Getting Started with the RansomStop Dashboard
Overview
Welcome to the RansomStop Dashboard walkthrough. This guide covers the main features and navigation of the dashboard.
Dashboard
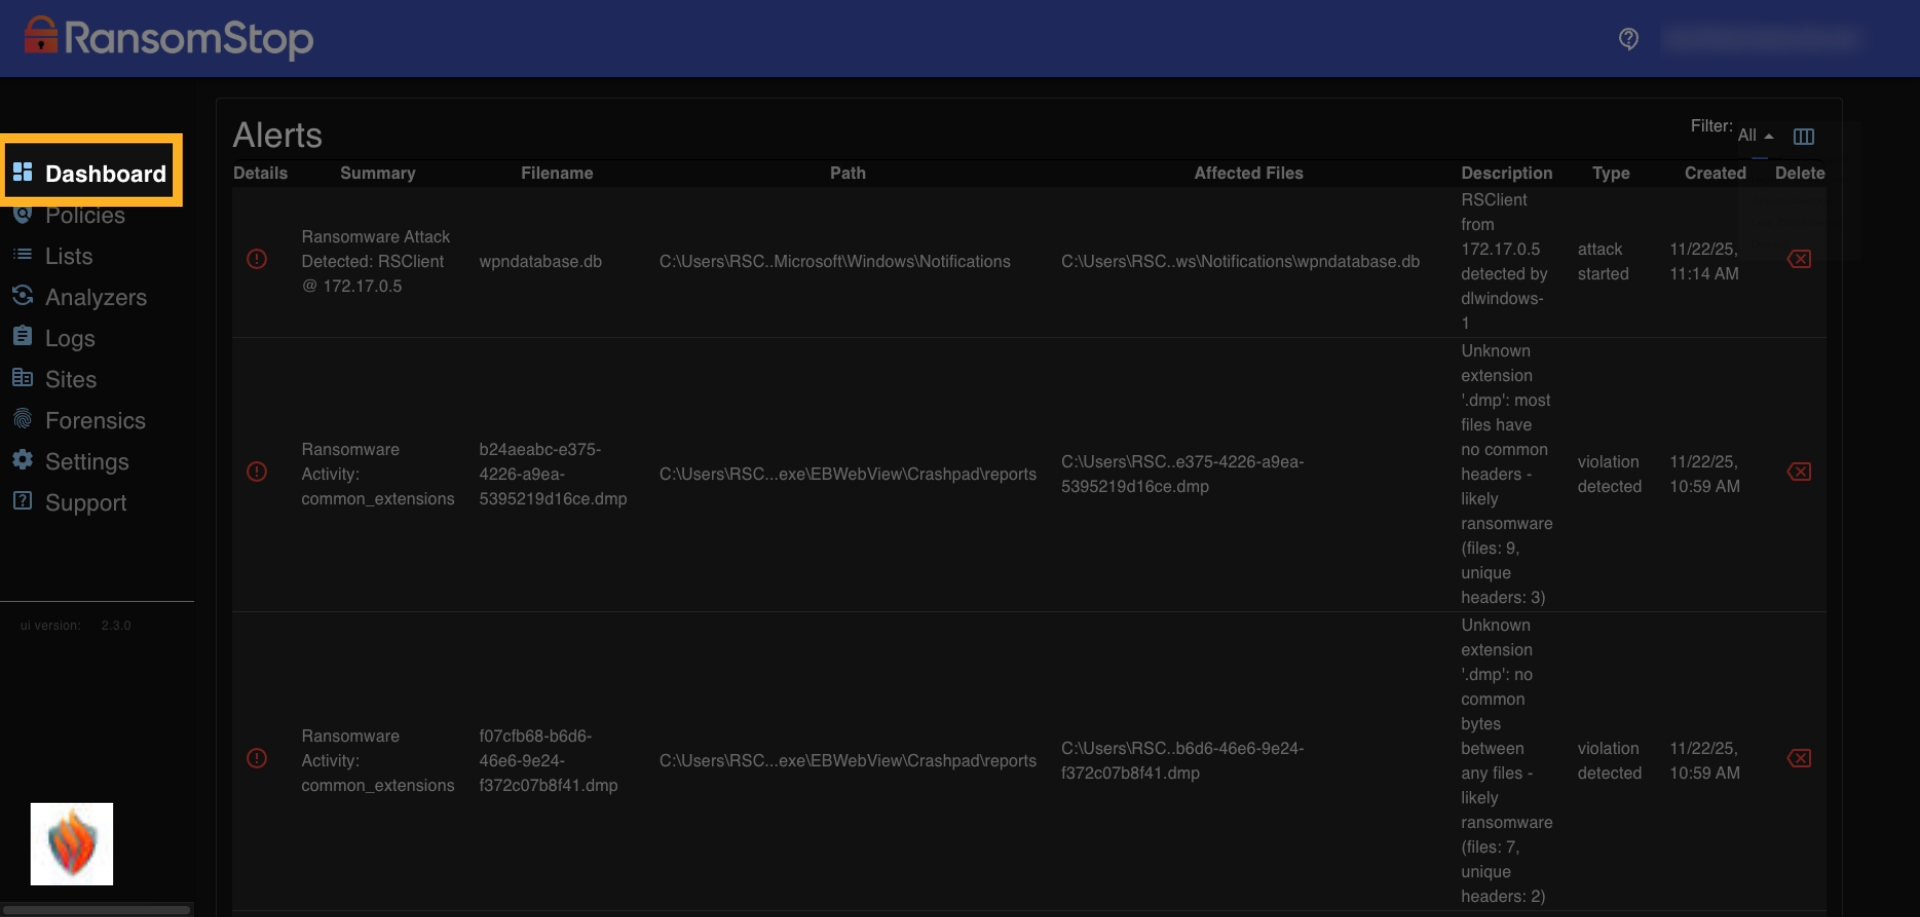
1. Alerts
The dashboard is the default log on screen. It gives you a quick overview of alerts and file activity. Right after installation, these will be blank since no data has been collected yet. As the system begins monitoring, you'll start seeing alerts and activity populate here. Once RansomStop begins monitoring your system, alerts will start to appear here in the dashboard. Each alert shows the type of threat, the file involved, and a summary of what was detected.
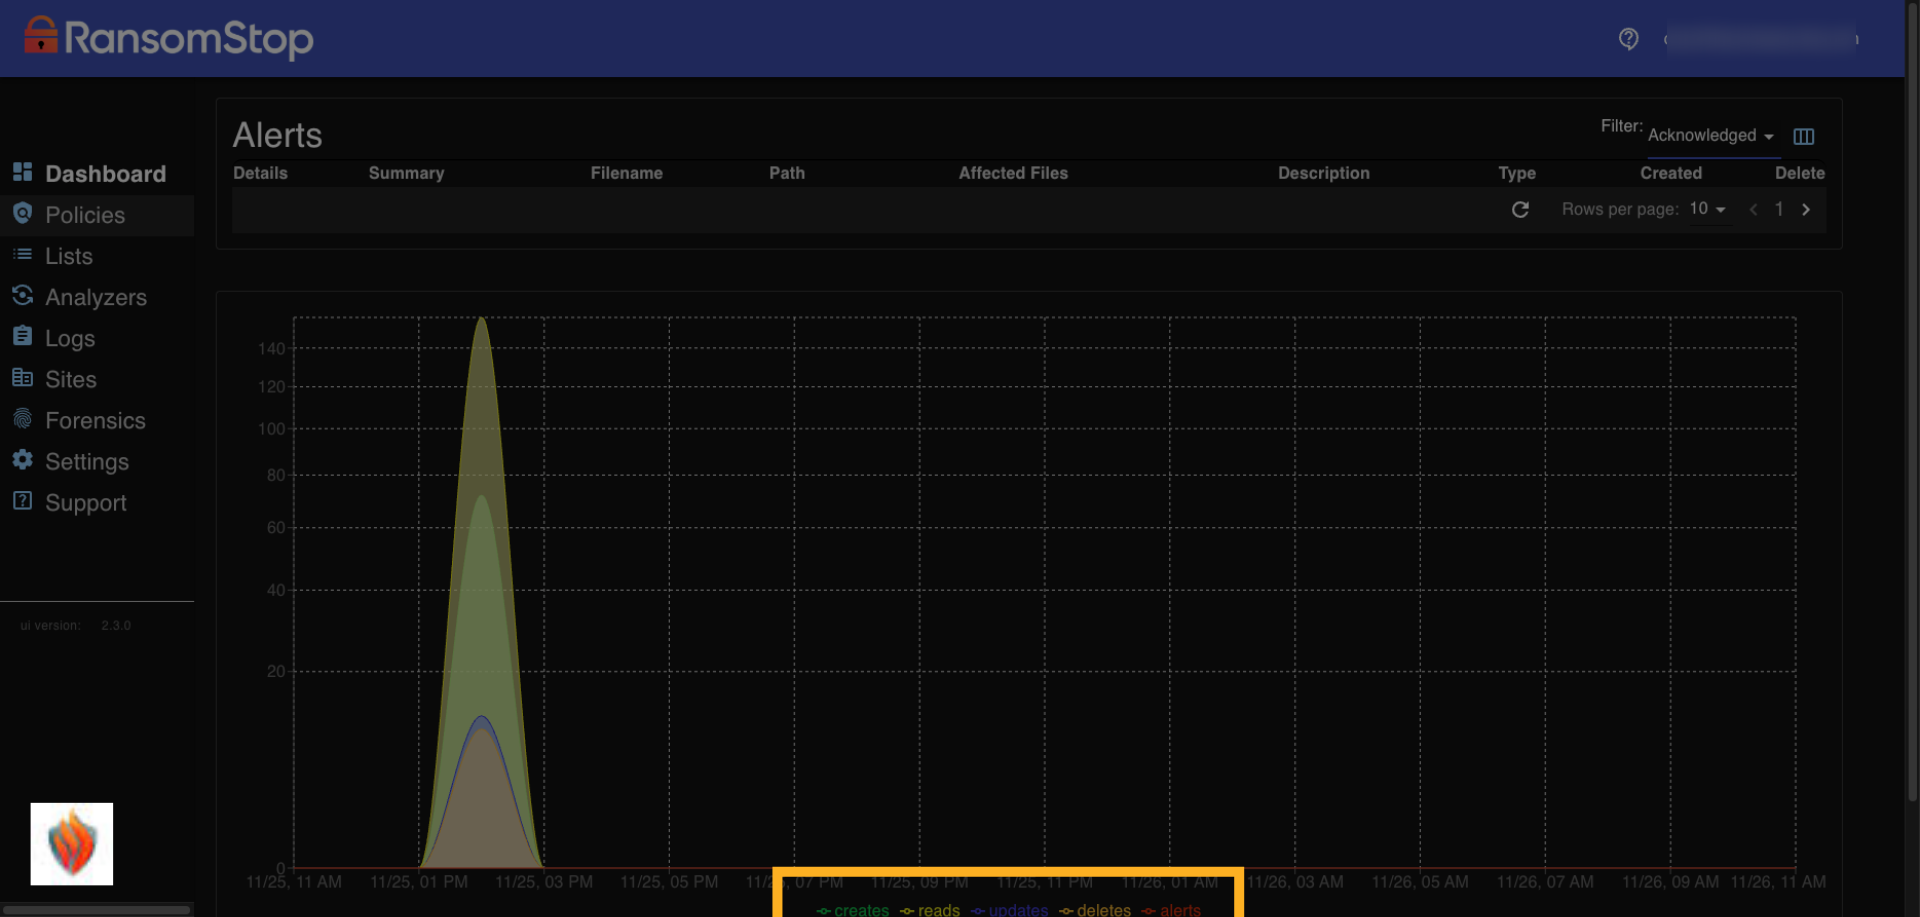
2. File Activity
The alerts are at the top part of the screen and the file activity is at the bottom of the screen. The file activity lets you quickly identify all of your file activity including Create, Read, Update, Delete, and Alerts.
Policies
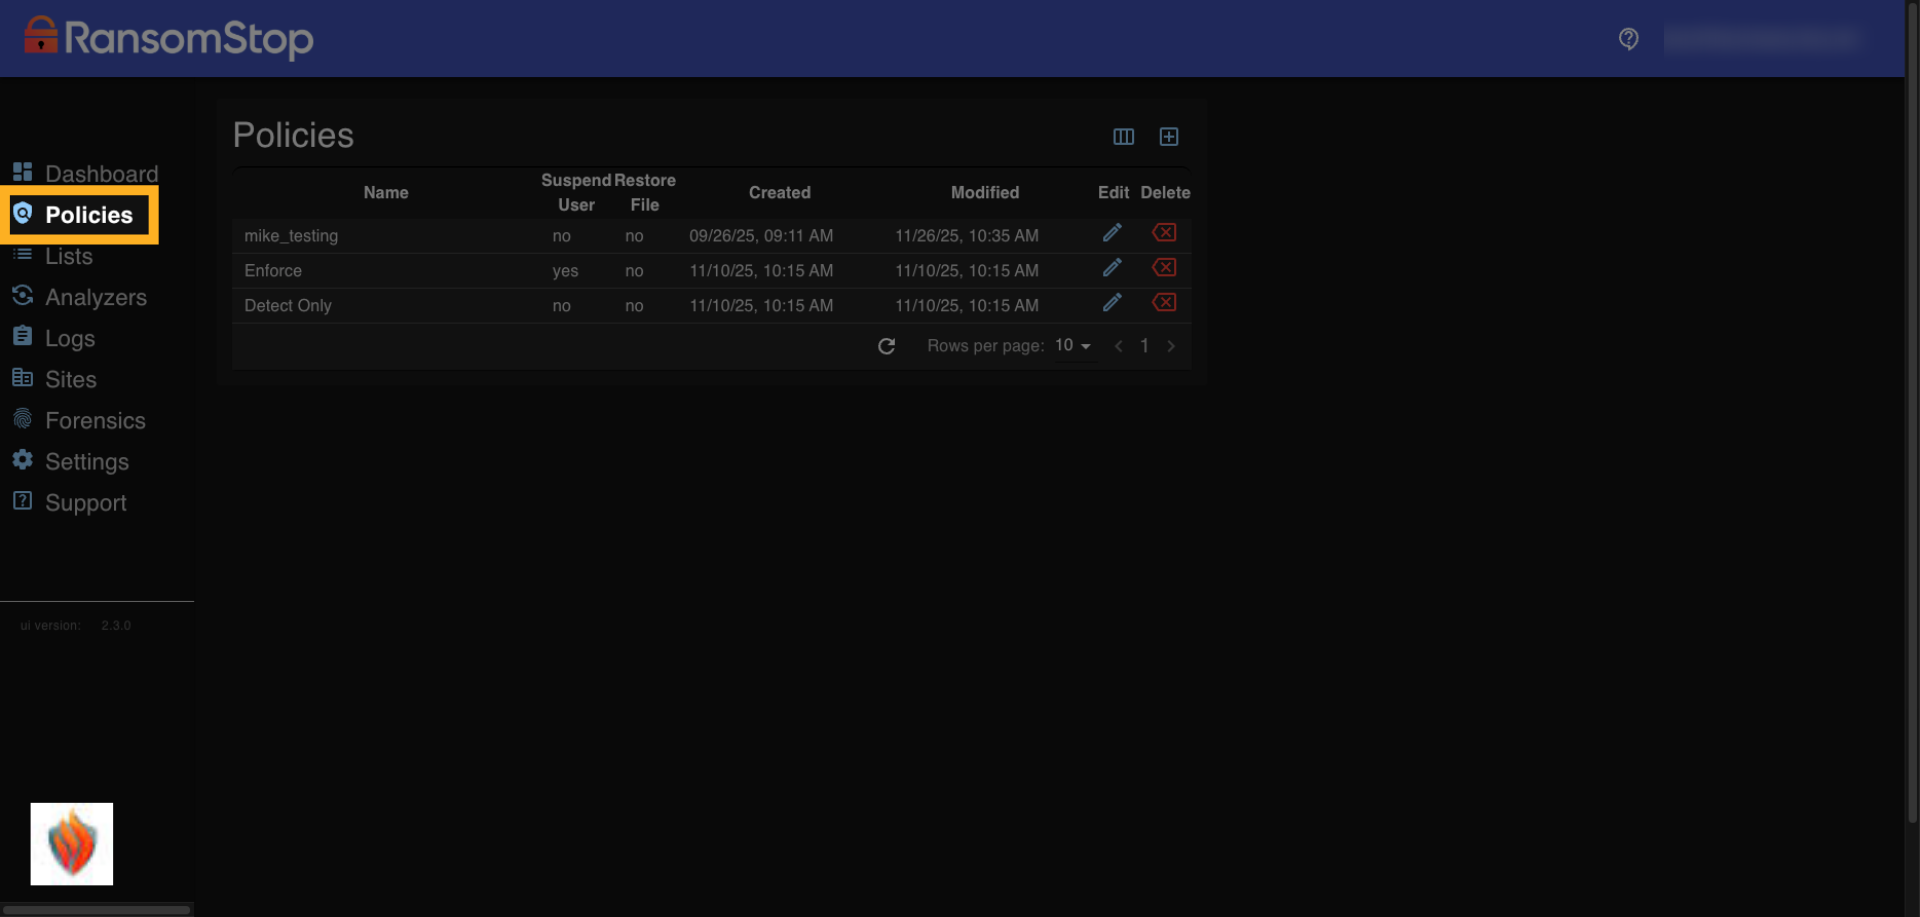
3. Policies Overview
When you first click on the Policies tab you'll see a list of default policies, typically Enforce and Detect. However, you can add custom policies. Policies define how RansomStop responds to threats.
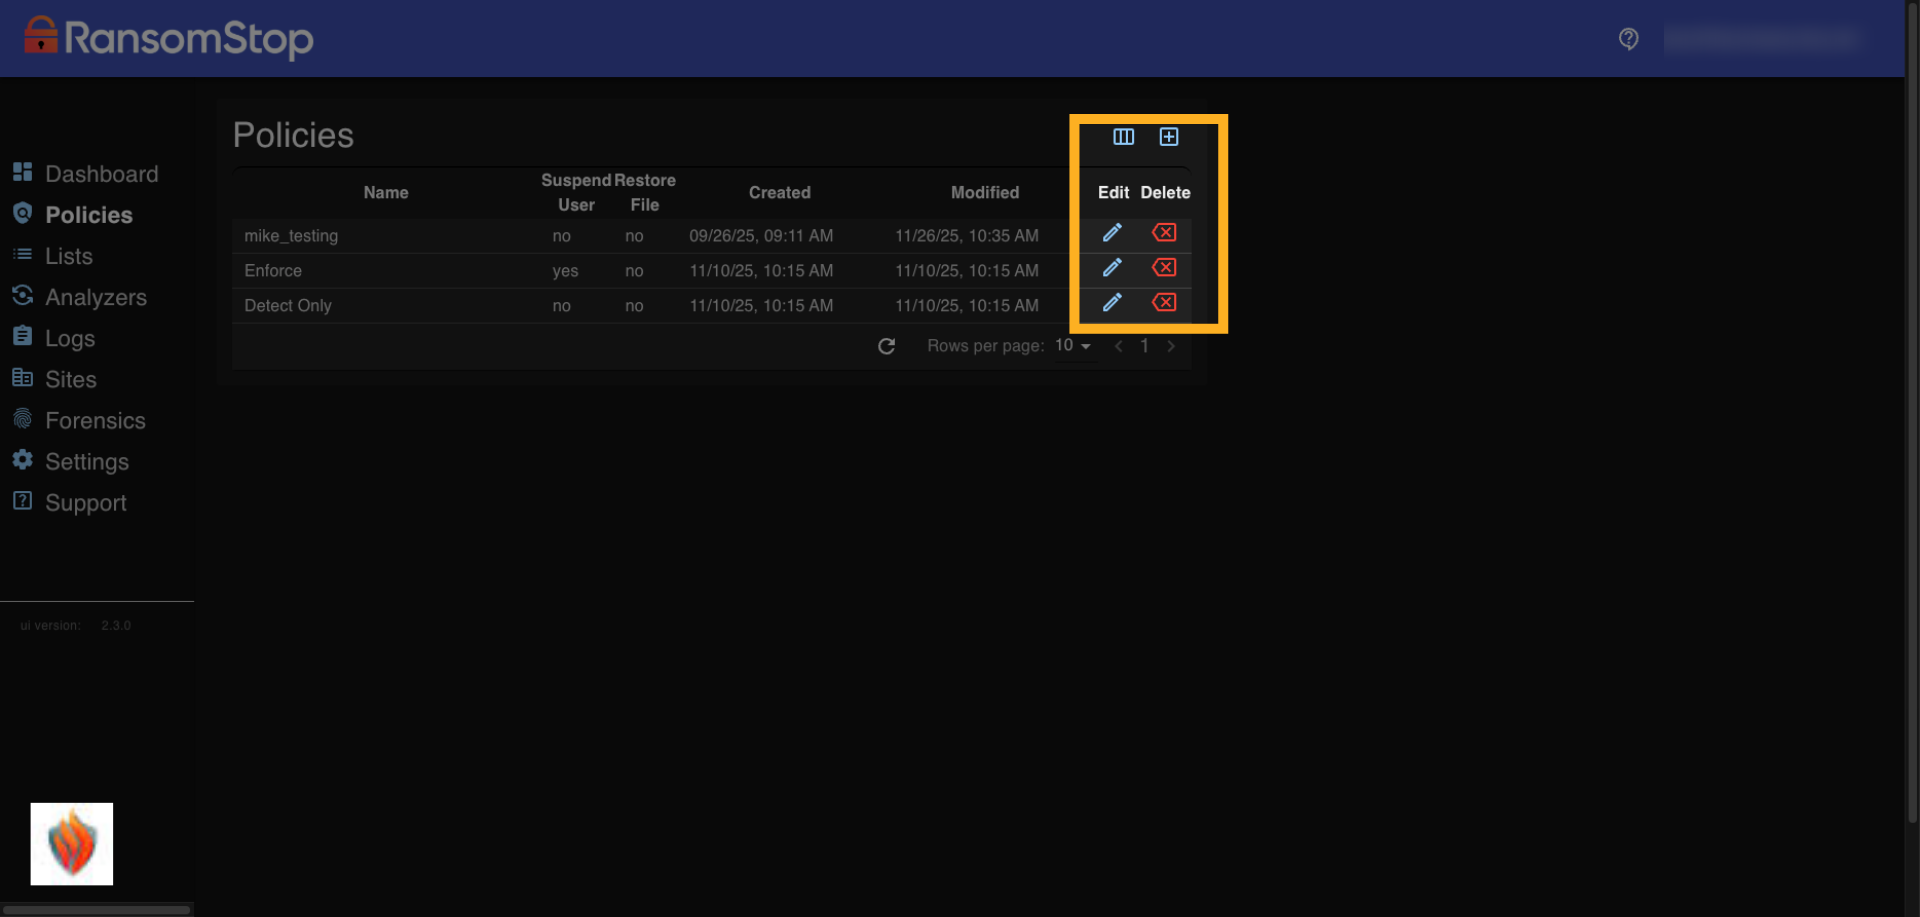
4. Edit Policies
If needed you can edit or delete a policy using the icons on the right. You can also add a new policy to customize how threats are handled on your system.
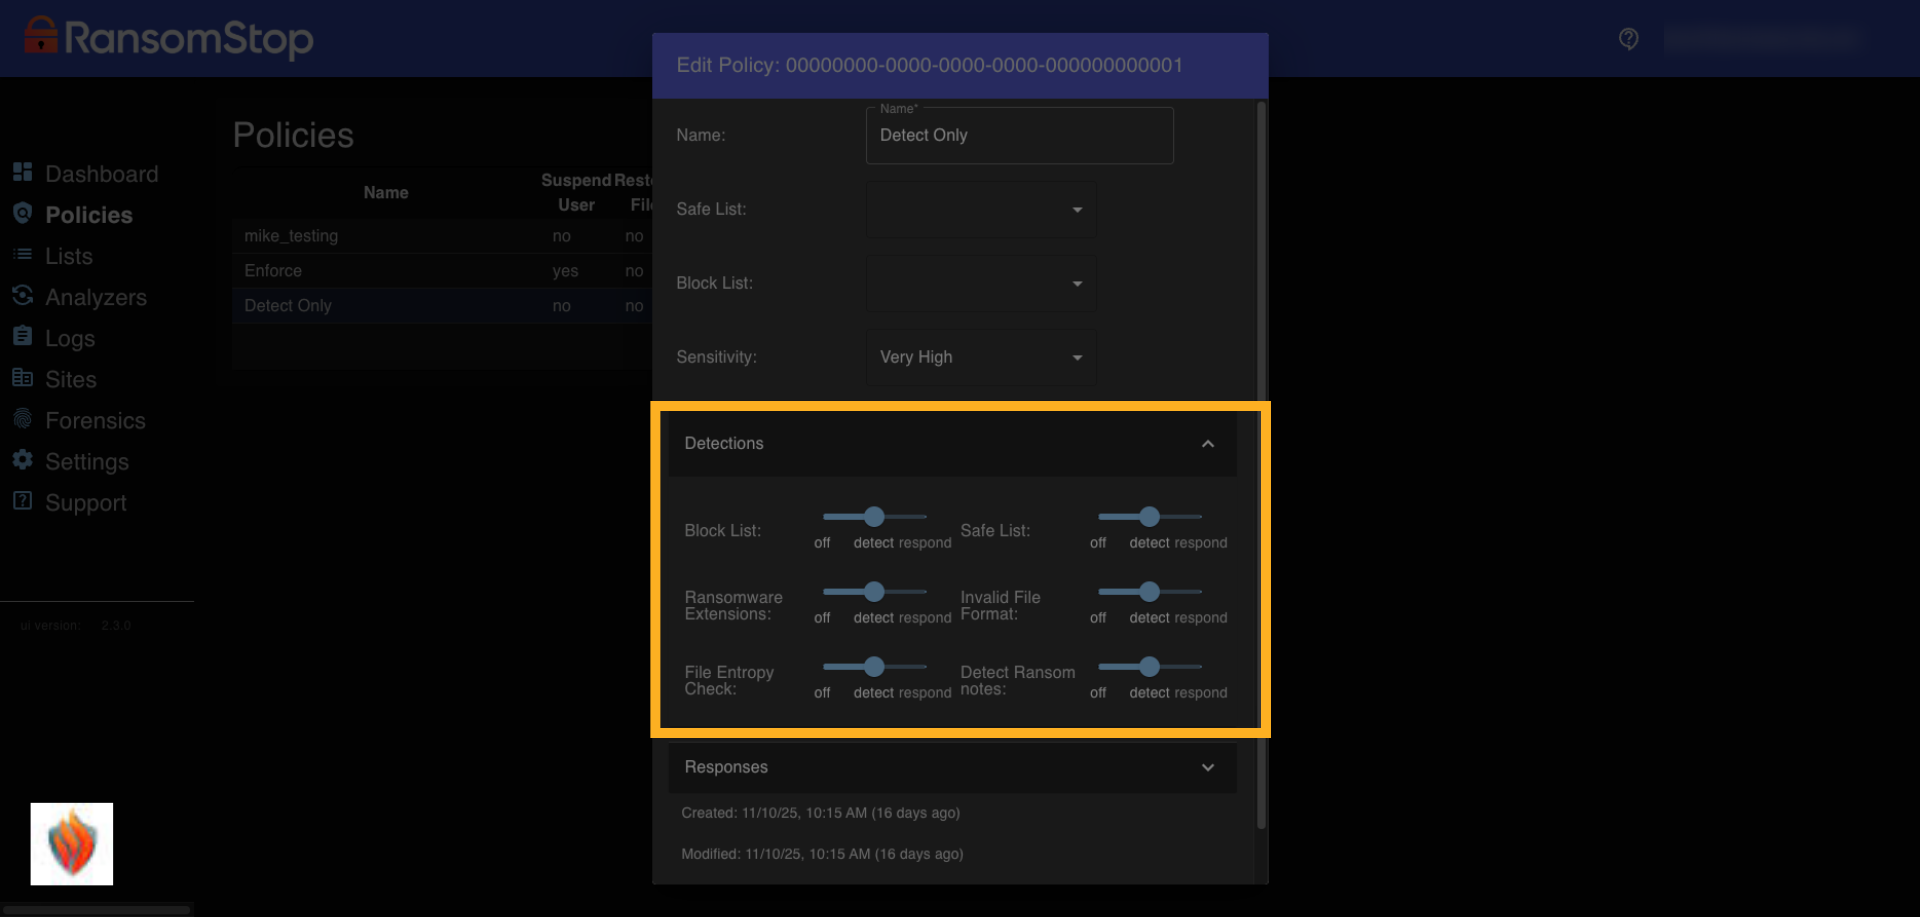
5. Detections
This screen lets you configure how RansomStop handles different types of detections. For each method like block list checks, ransomware identification, and entropy analysis, you can choose whether to Ignore it, Detect it, or Detect and Respond. These settings help you control which threats are monitored and whether they trigger a response.
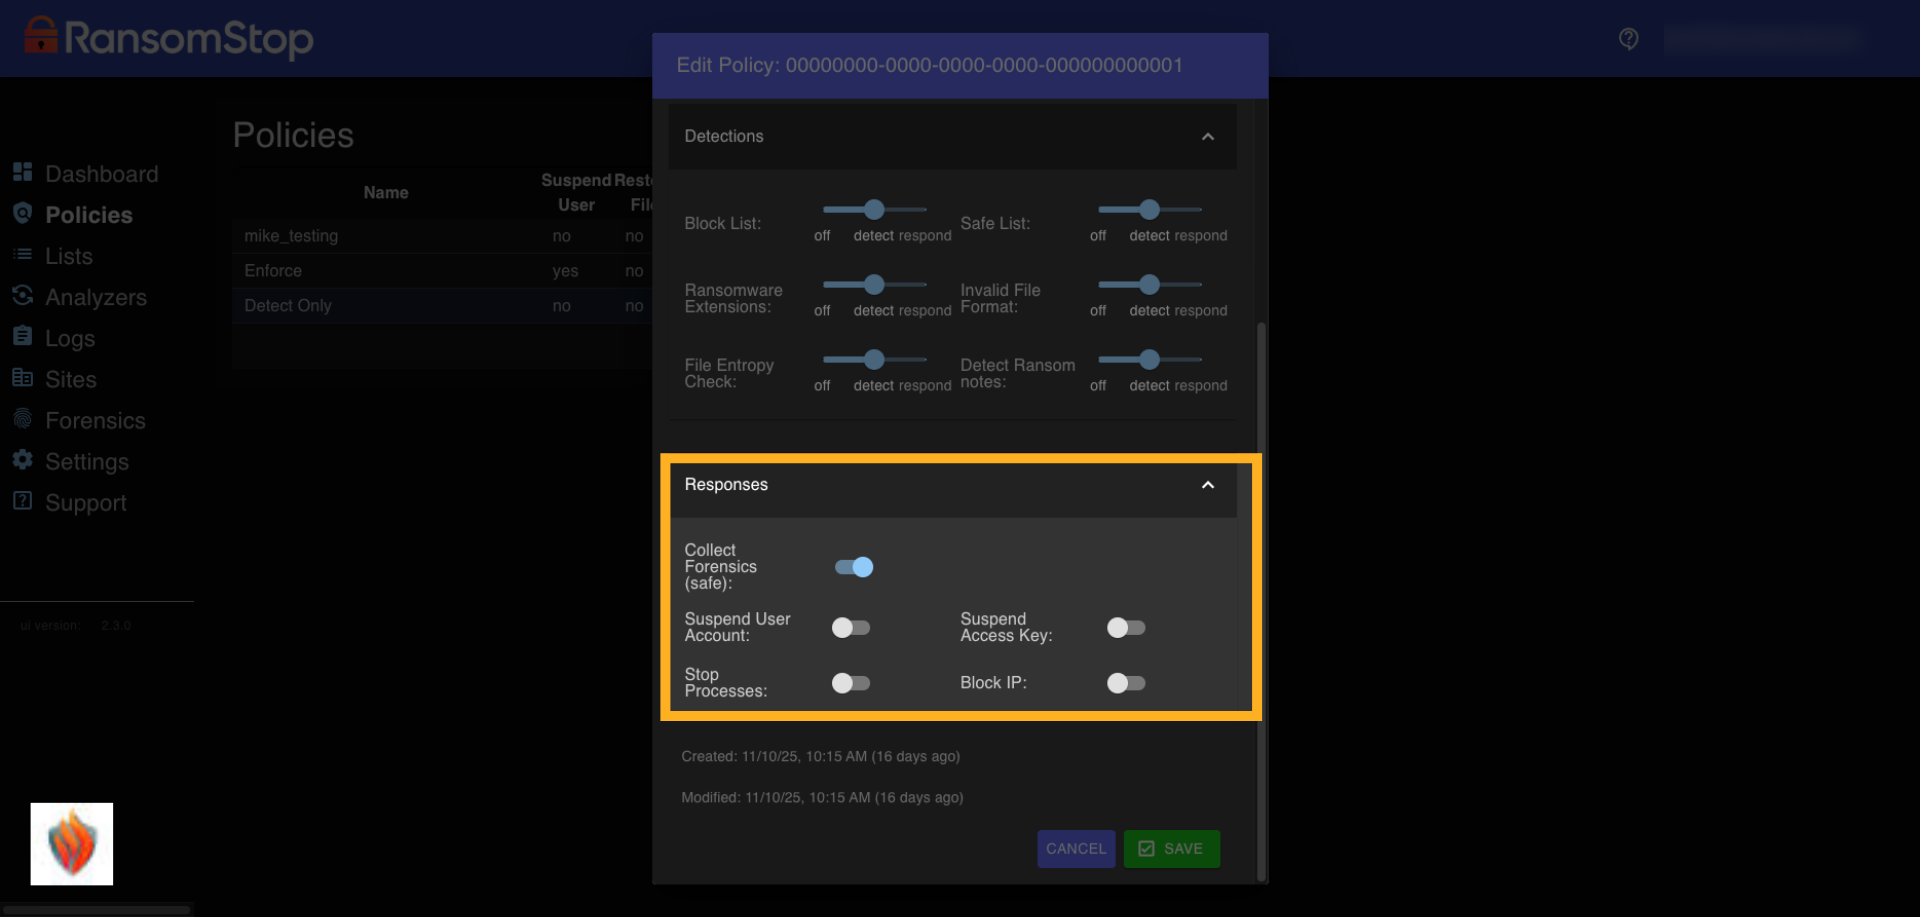
6. Responses
Once a threat is detected and set to Enforce mode, RansomStop can take automated actions to contain it. You can choose to collect forensic data, suspend the user or process involved, or block the IP address. These options help you quickly isolate and investigate threats without manual intervention.
Analyzers
7. Analyzers Overview
Analyzers are the core components of RansomStop's deployment. Each analyzer monitors activity on a machine and can be configured to detect and respond to ransomware threats in real time.

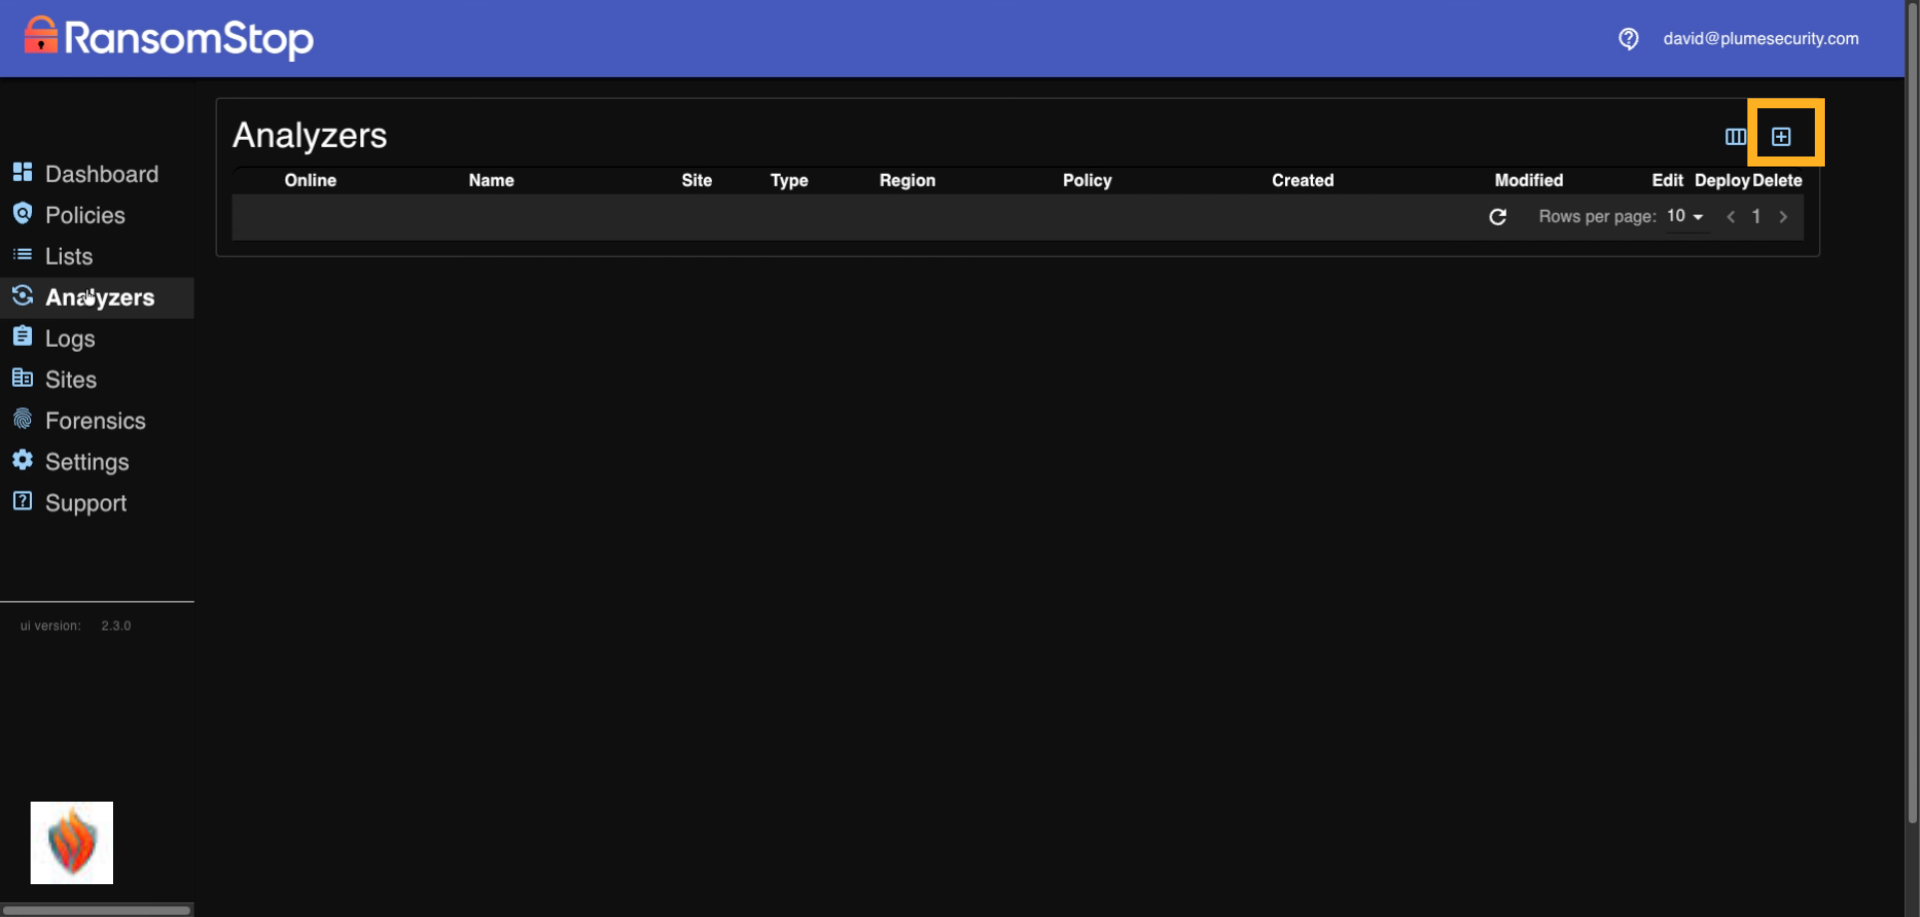
8. Analyzers (Blank State)
When you first access the Analyzer section, this page will be blank. If you've already installed a Windows analyzer, it should appear here automatically. To add a new analyzer manually, click the plus sign in the upper right hand corner.
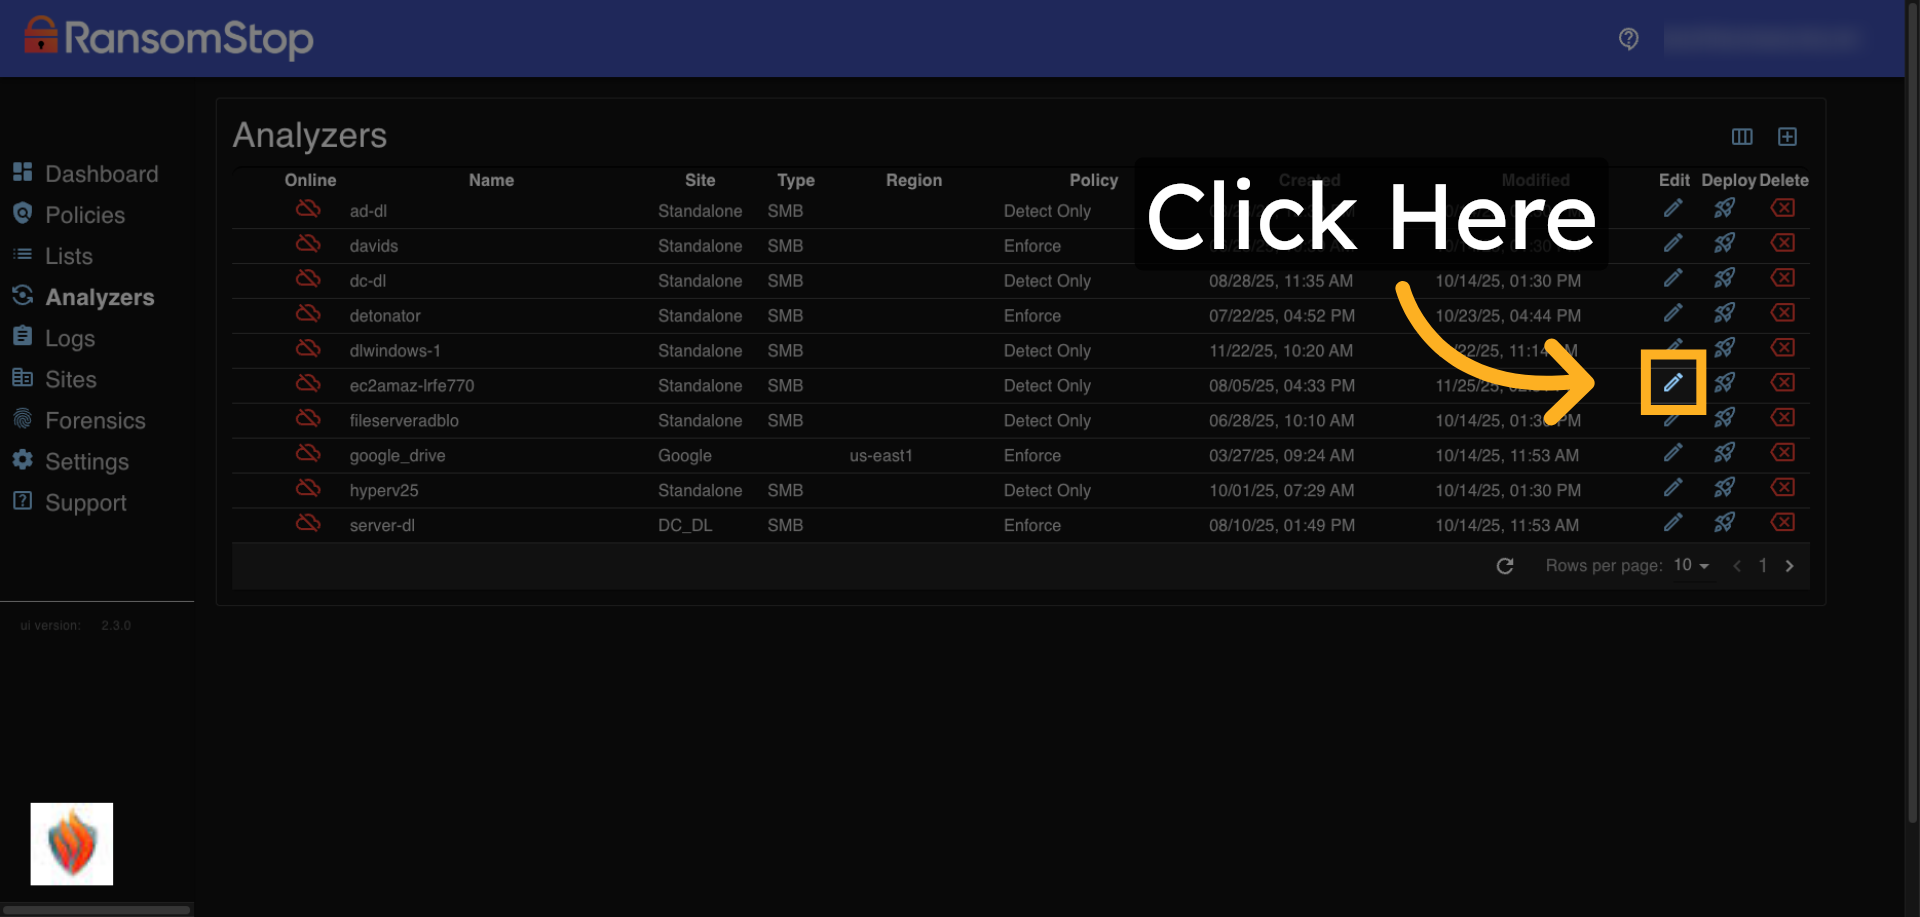
9. Installed Analyzers
Once analyzers are installed, either through automated deployment or manual setup, they'll appear in this table. Each row represents an active analyzer and includes details like its Name, Site, Type, Region, and assigned Policy. This view helps you monitor which machines are protected and how they're configured. To customize an analyzer's behavior, click the edit icon next to the one you want to modify.
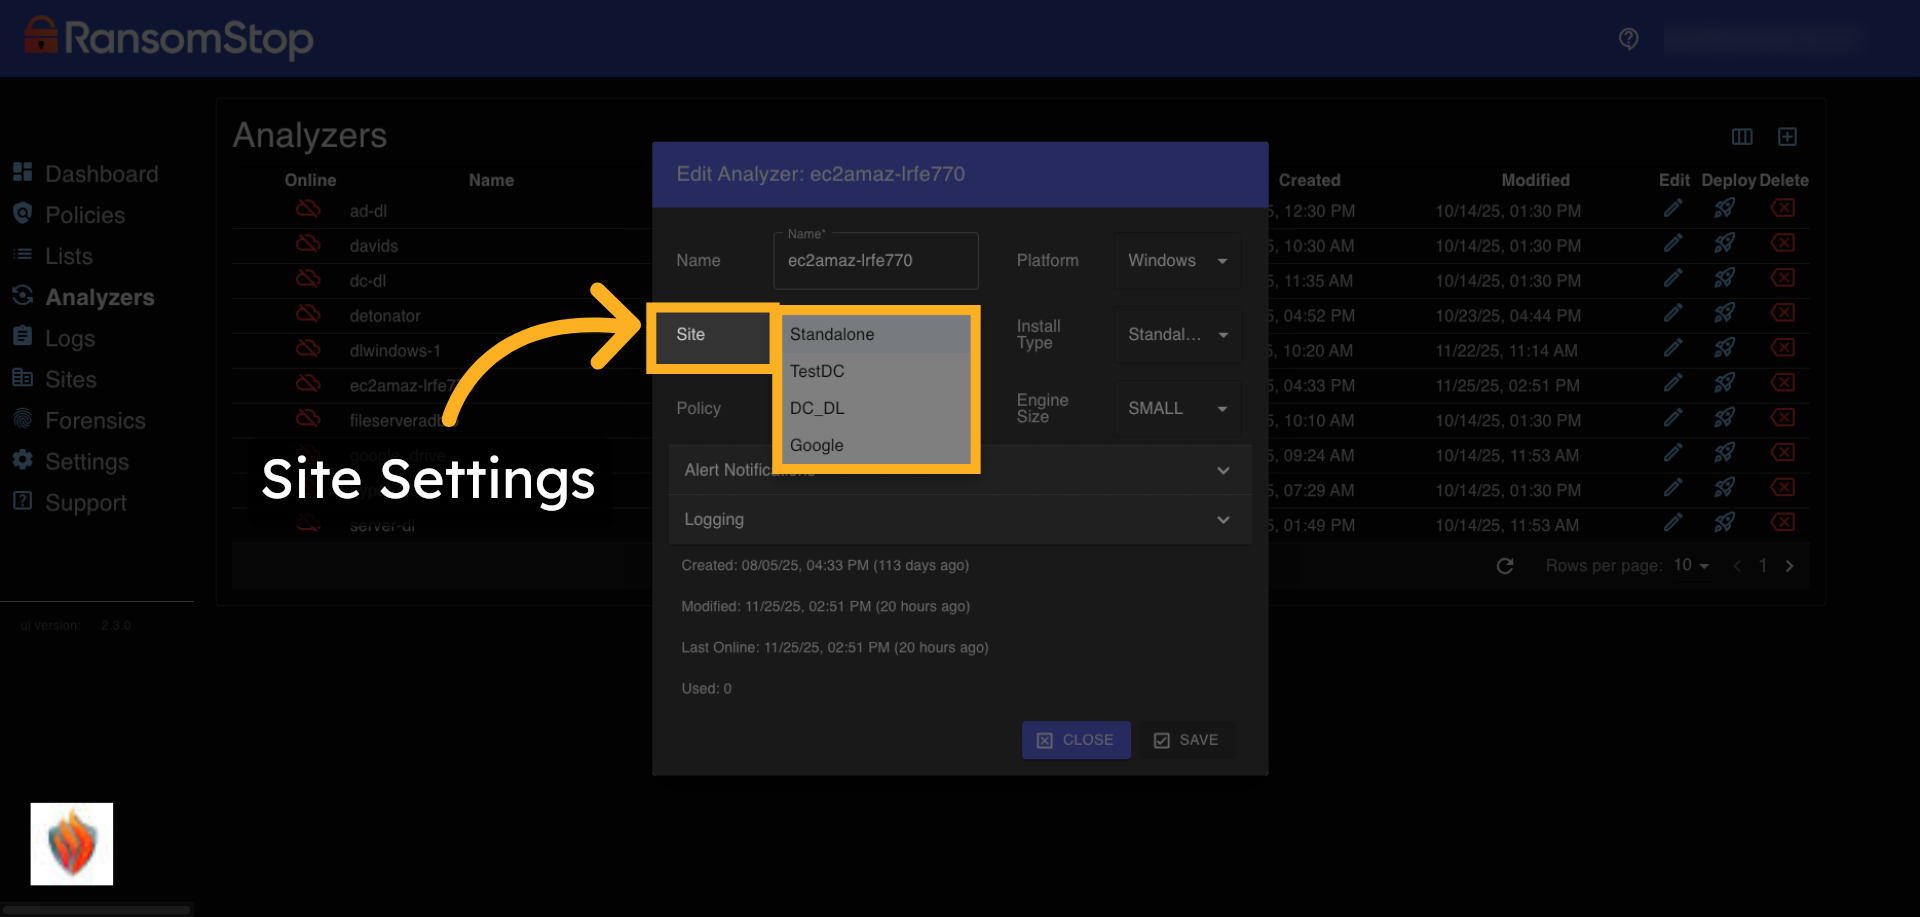
10. Site Settings
When editing an analyzer, you can assign it to a specific site. In the initial setup, analyzers are typically deployed as standalone units, one per machine. If this isn't your first install, you may have the option to place the analyzer into a site that's already been configured. Site assignment helps organize analyzers across your environment and will be covered in more detail later.
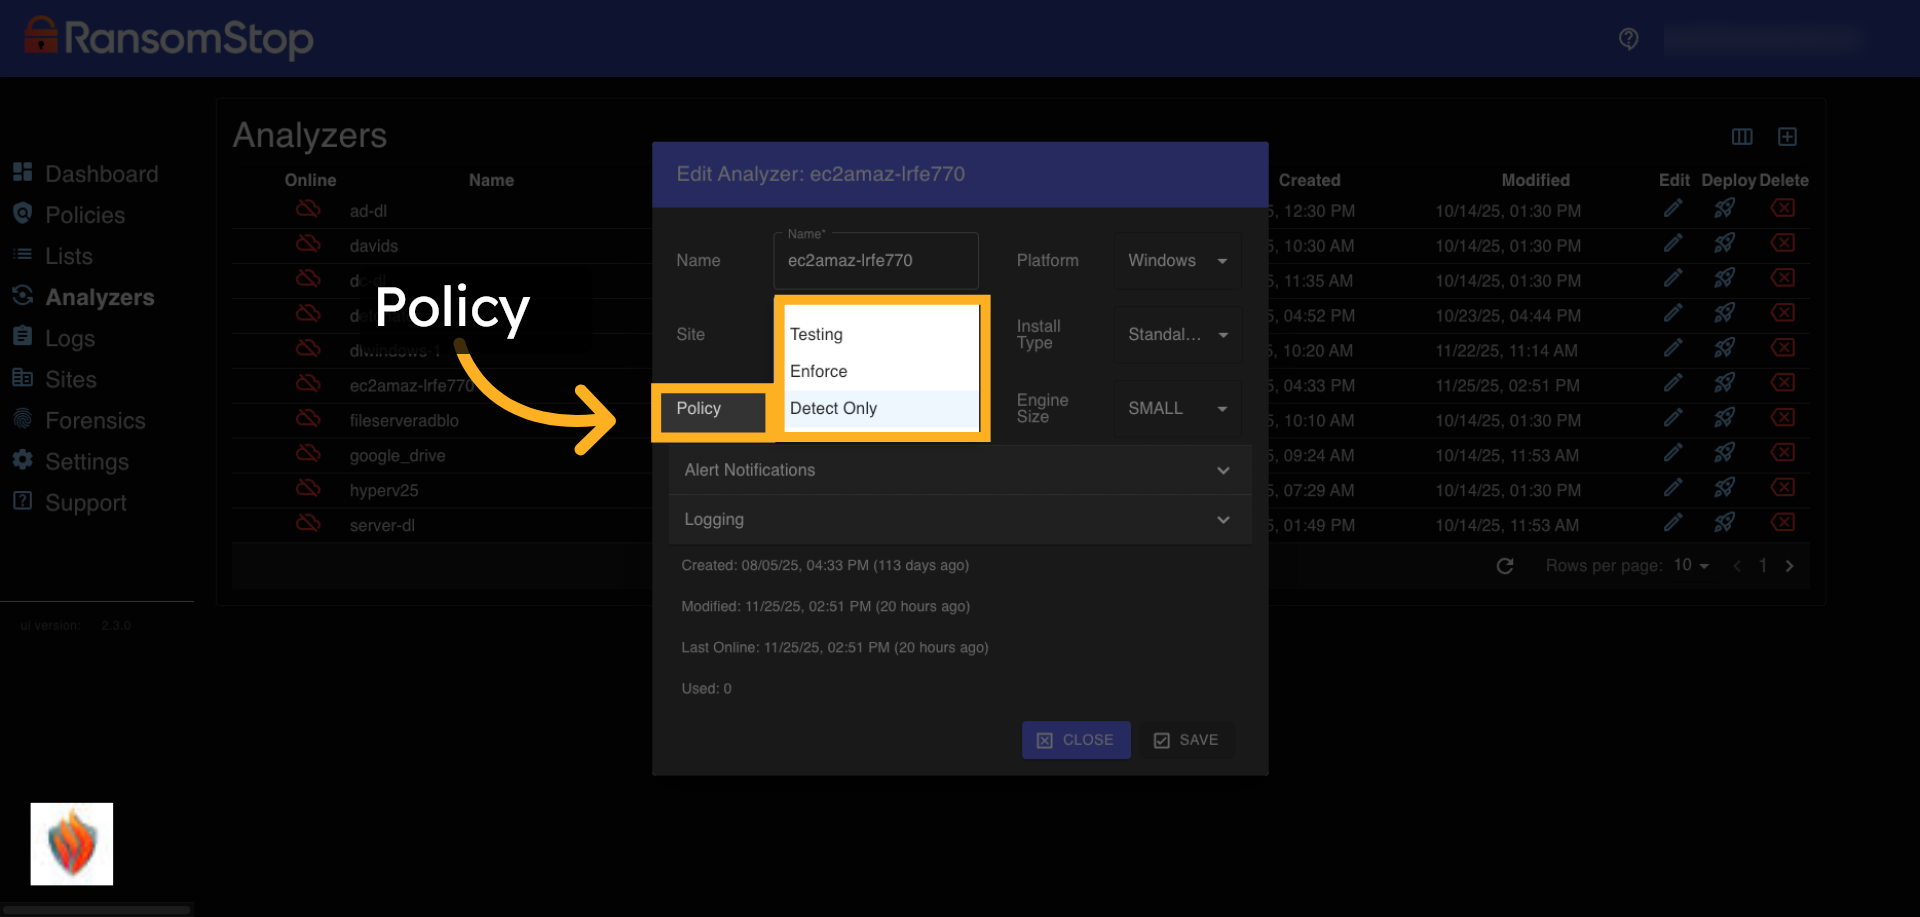
11. Policy Options
This drop-down lets you assign a policy to the analyzer. Common options include Detect Only and Enforce, but you can also select from any custom policies you've created. This setting determines how the analyzer will behave—whether it simply detects threats or actively responds to them.
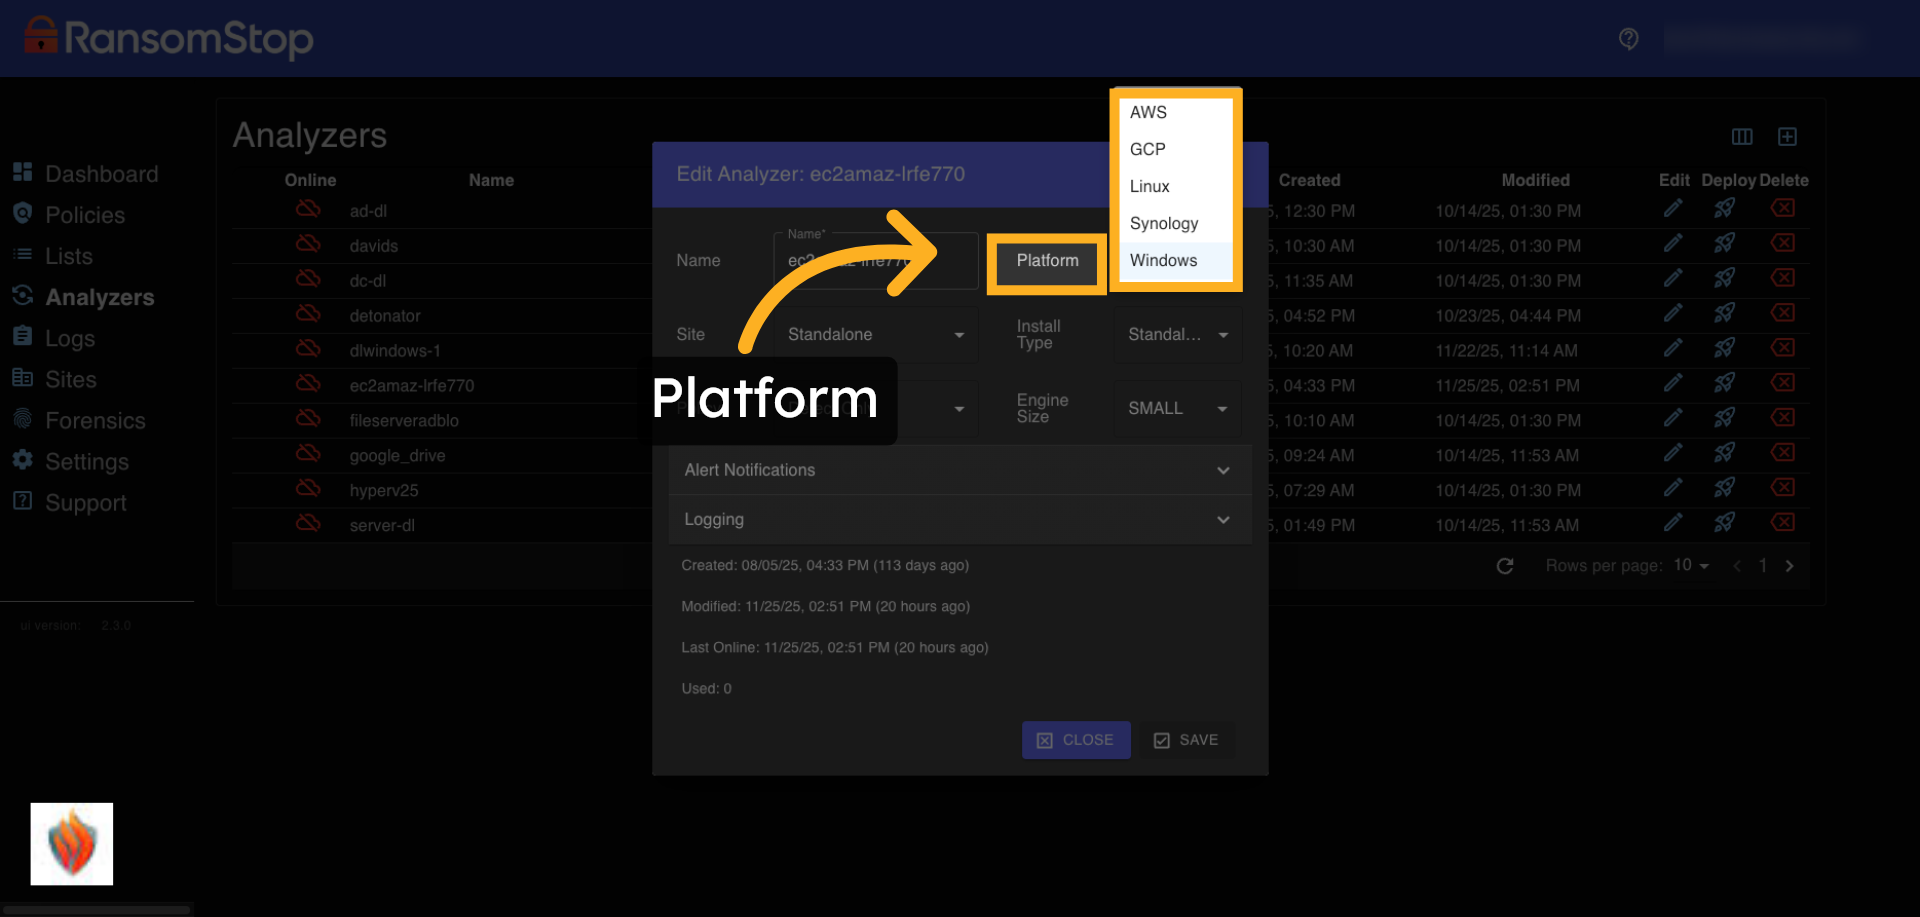
12. Platform Options
This drop-down lets you choose the platform where the analyzer will operate. It represents the underlying environment such as AWS, GCP, Linux, Synology, or Windows where files are monitored. This is typically configured during installation and helps RansomStop tailor its detection and response to the specific system architecture.
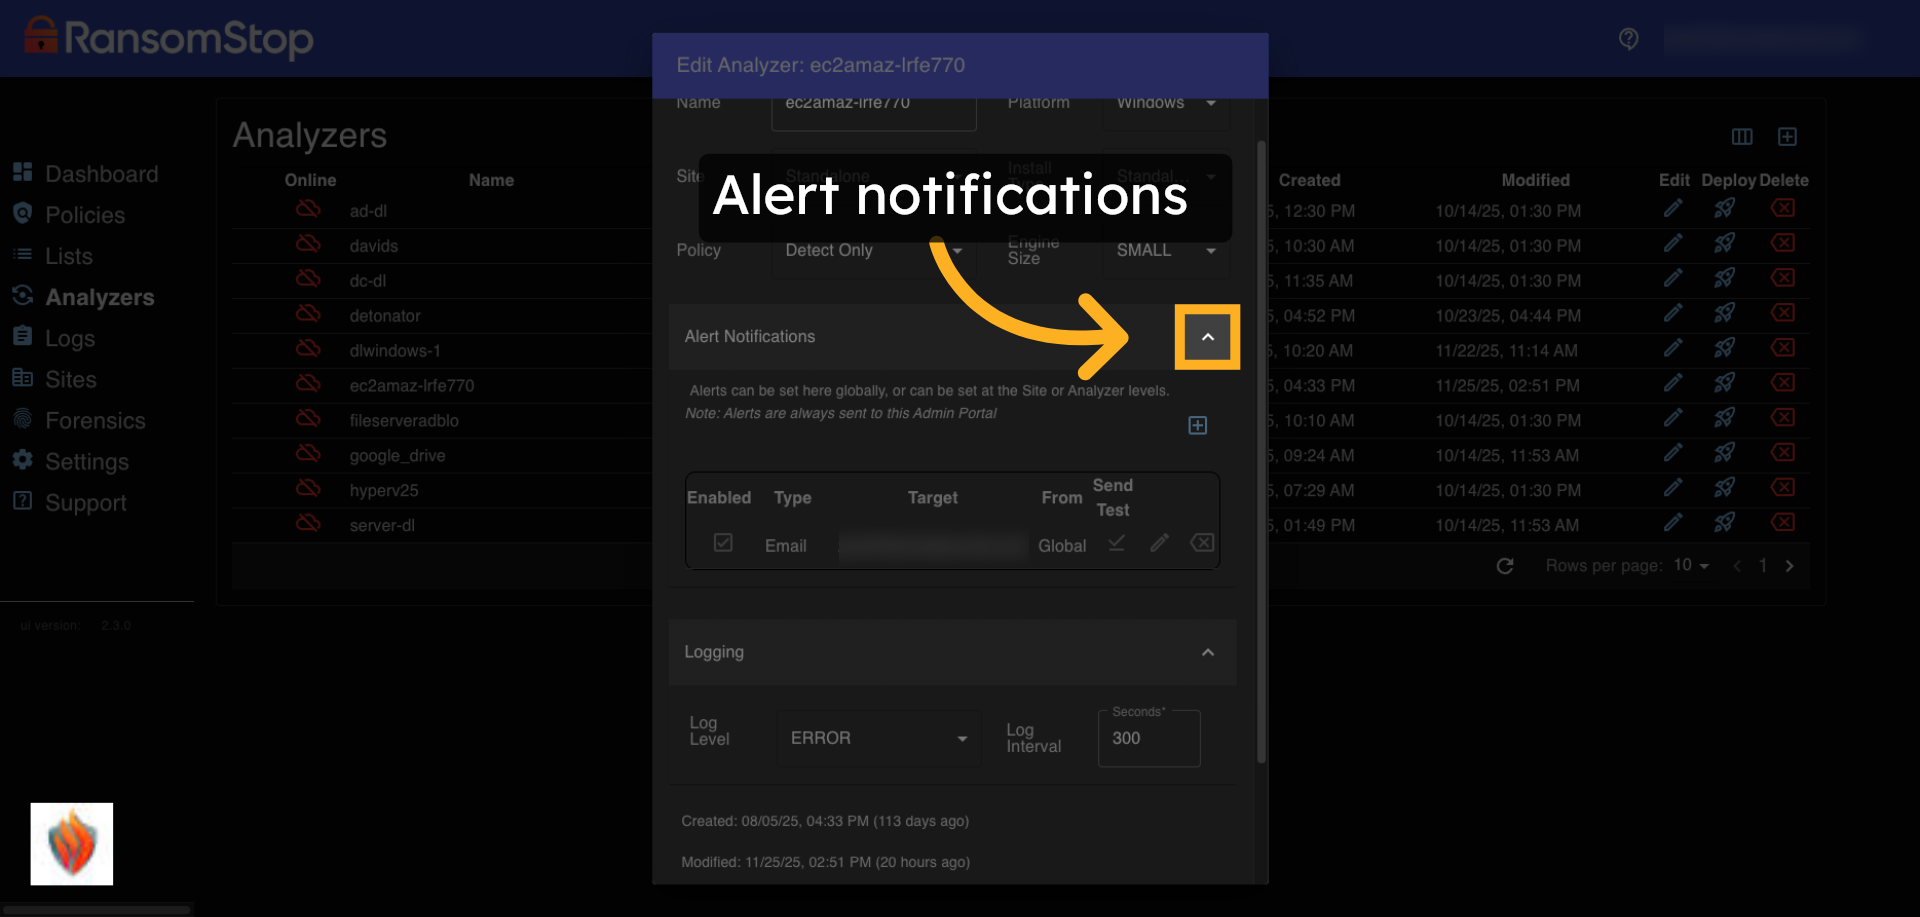
13. Alert Notifications
This section lets you configure alert notifications for the analyzer. Alerts can be set globally (applying across all analyzers) or locally (on a per-analyzer basis). This gives you flexibility to tailor notifications based on specific machines or environments. Regardless of where they're configured, alerts are always sent to the admin portal.
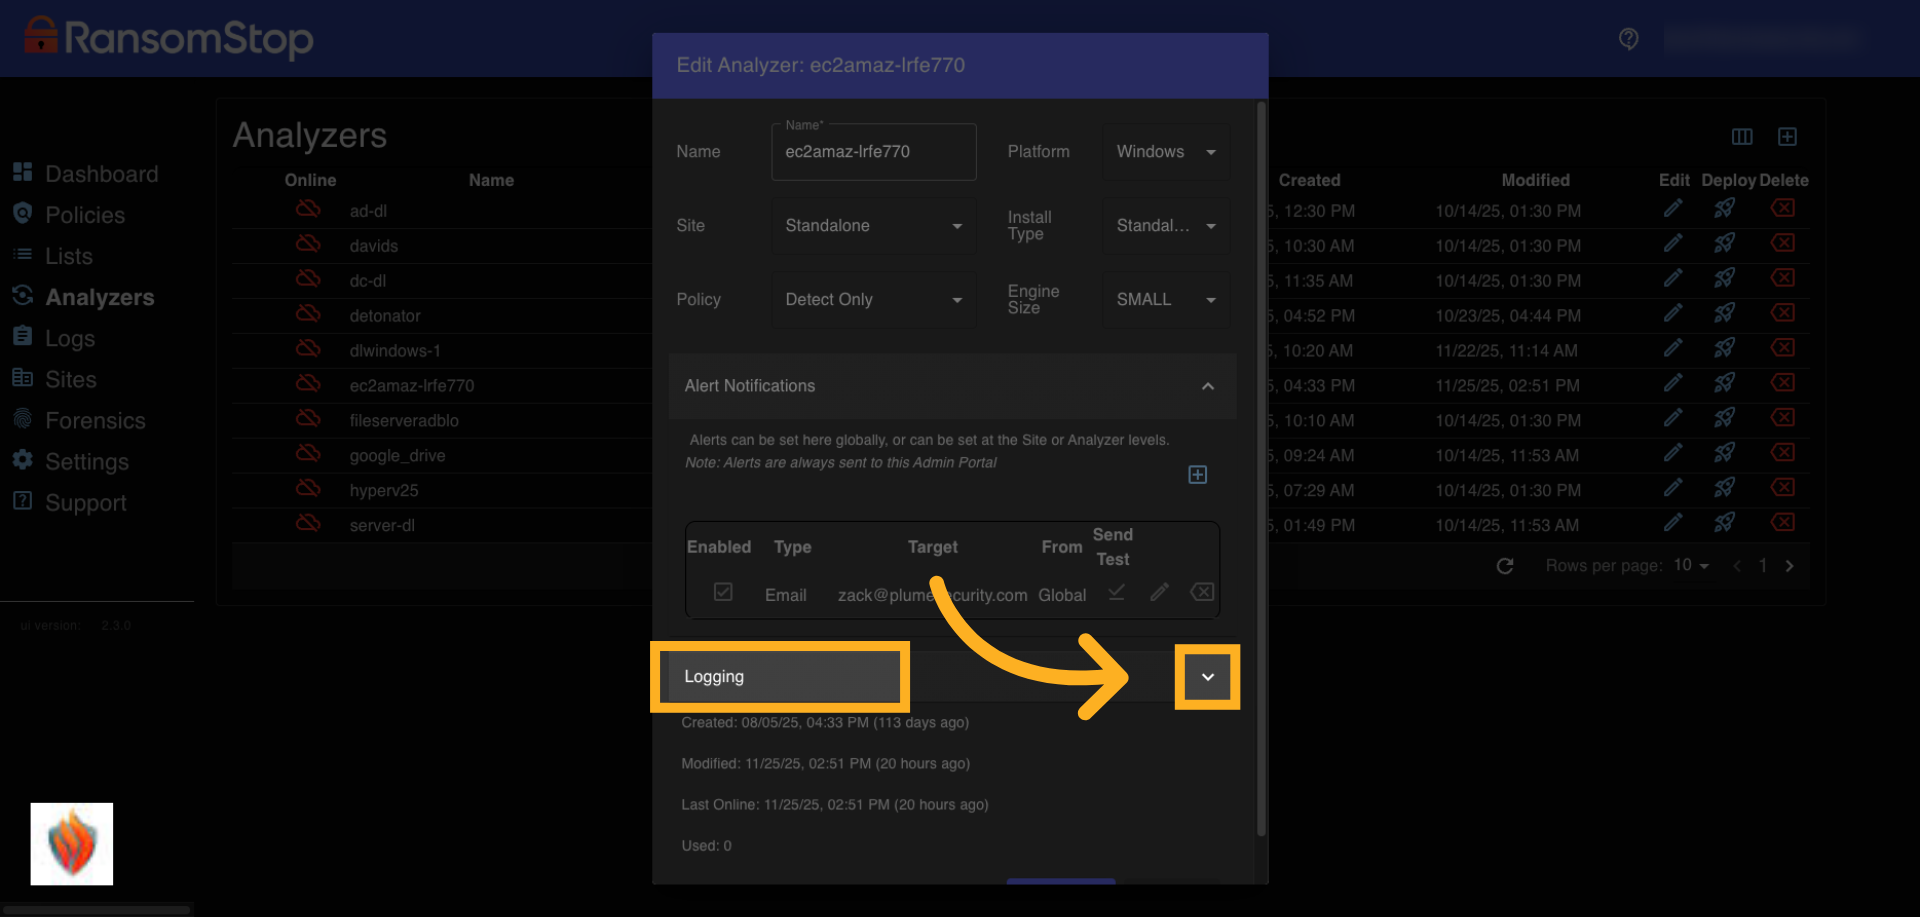
14. Logging
This section lets you configure logging for the analyzer. You can choose the log level (typically Error or Warn) depending on how much detail you want captured. You can also adjust the logging interval, which controls how frequently logs are recorded. These settings help balance visibility with performance depending on your monitoring needs.
Logs
15. Logs Tab
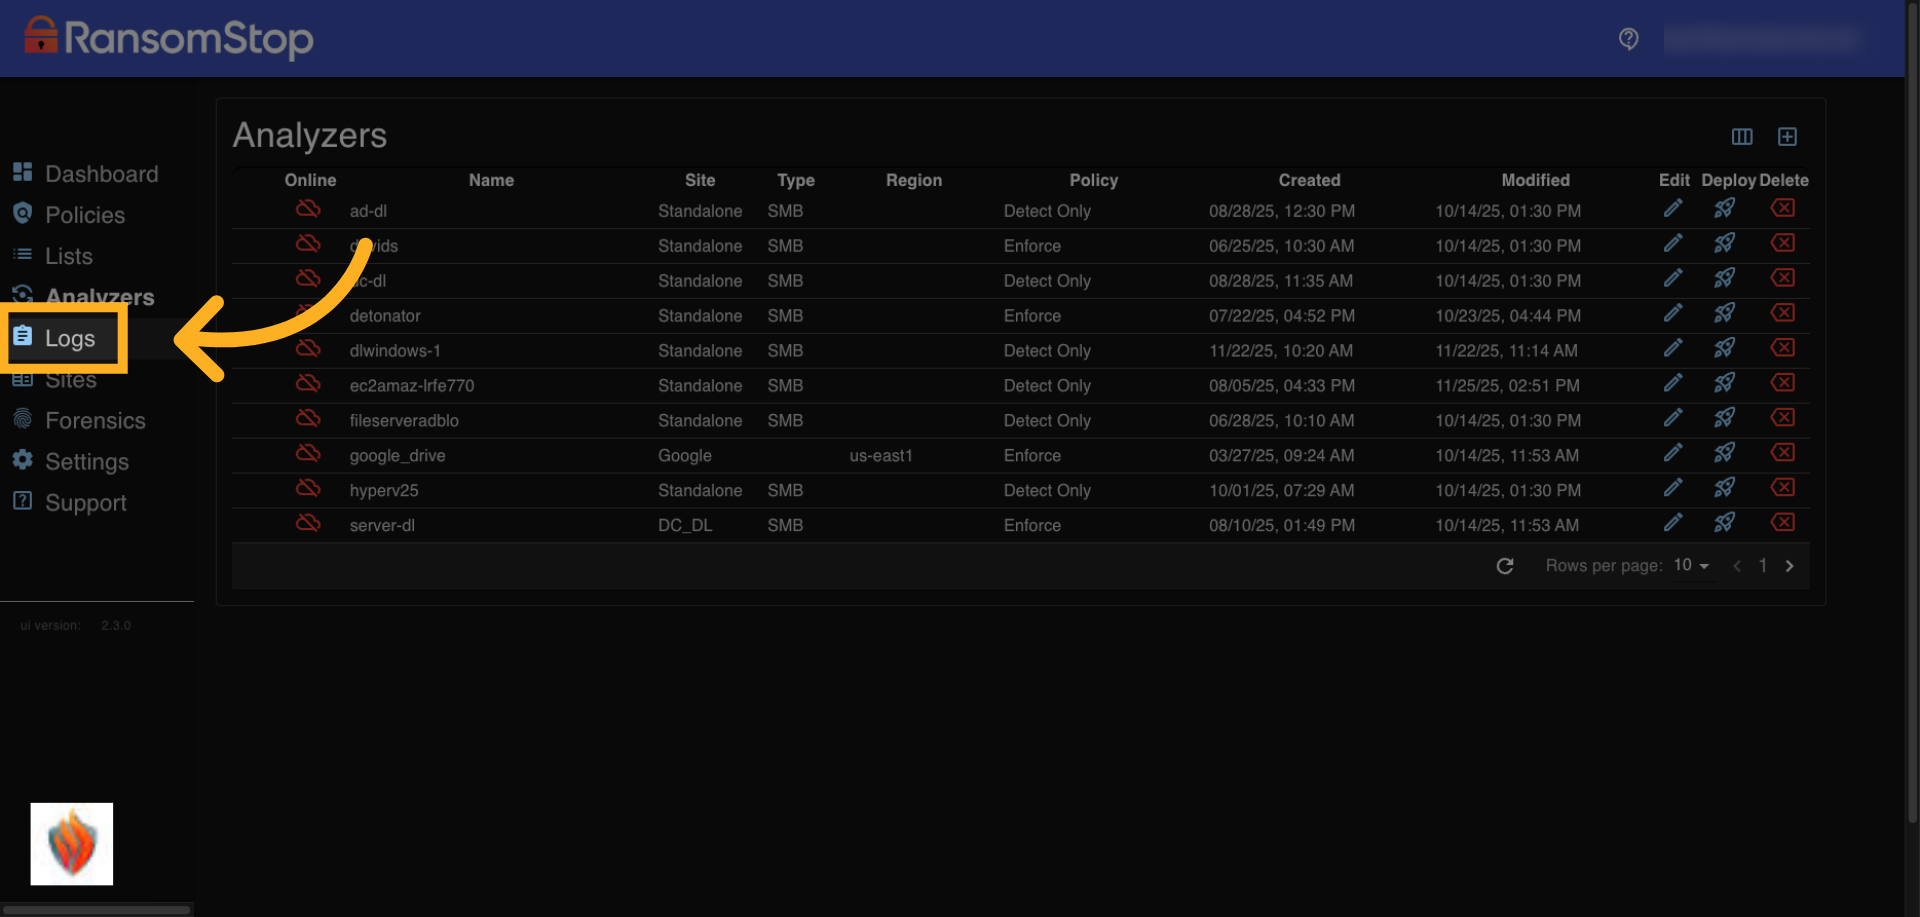
To view system activity and diagnostic messages, start by clicking the Logs tab in the left-hand sidebar. This section provides detailed insights into how each analyzer is operating, including warnings, errors, and system-level events.
16. Select Analyzer
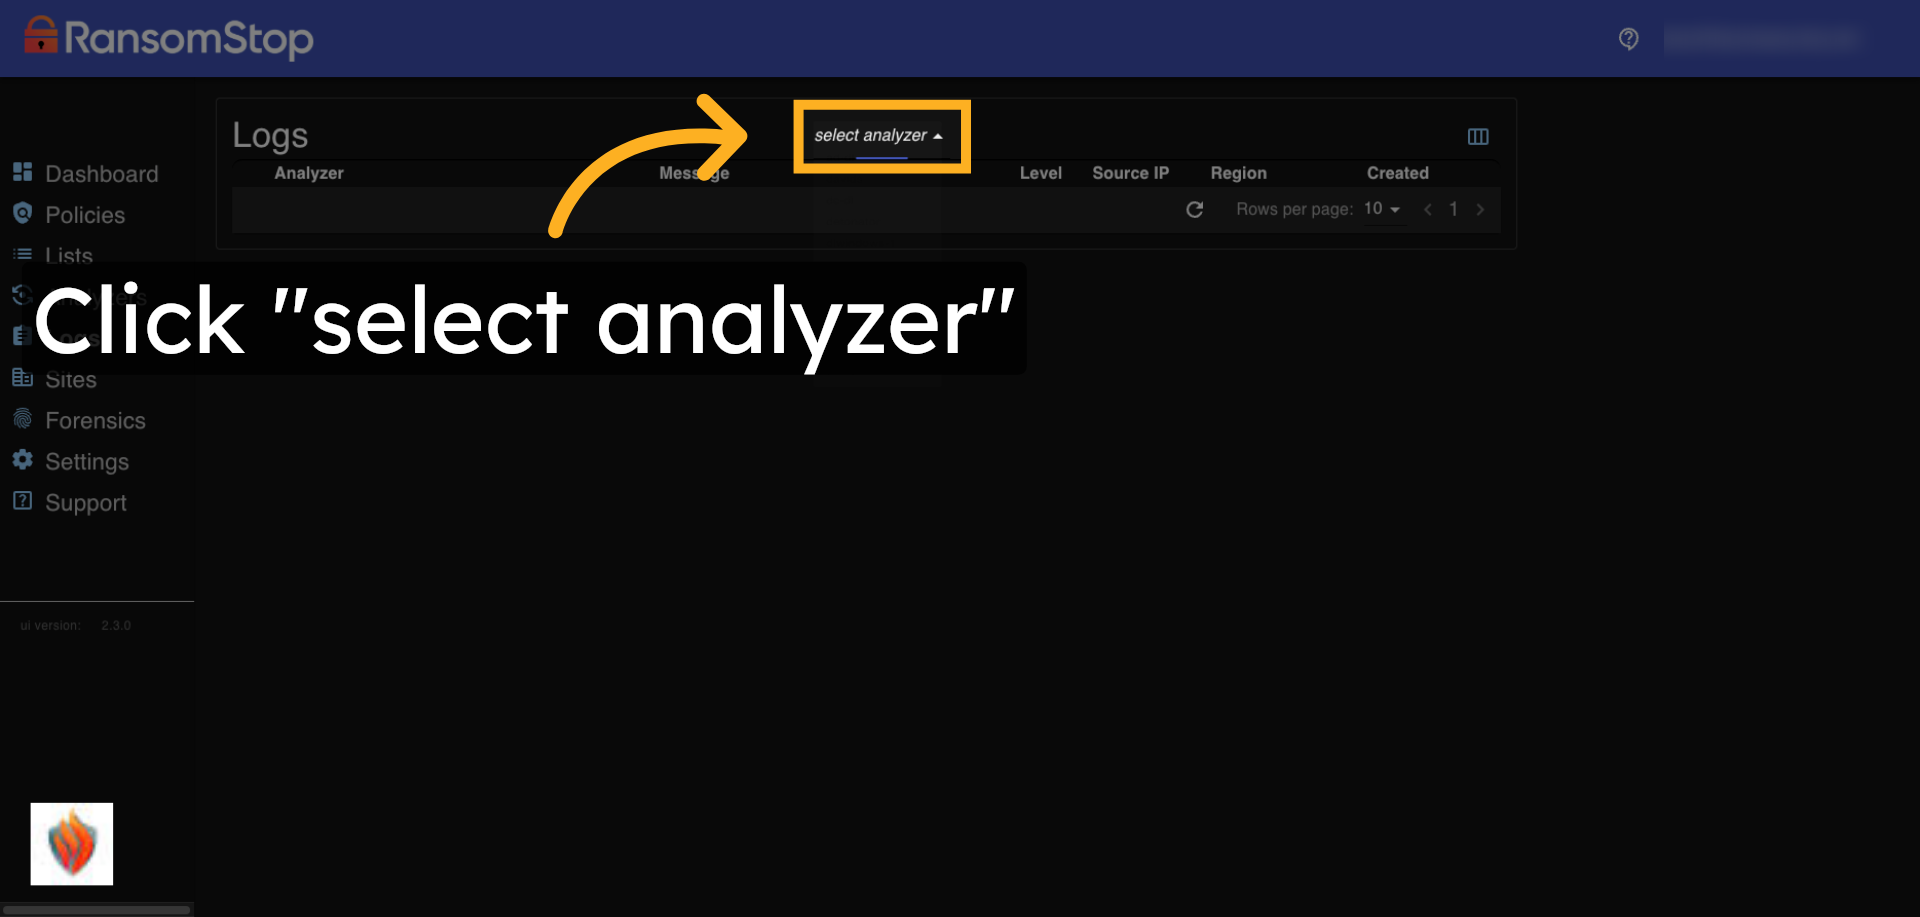
Once inside the Logs section, you can select a specific analyzer to view its activity.
17. Analyzer Selection
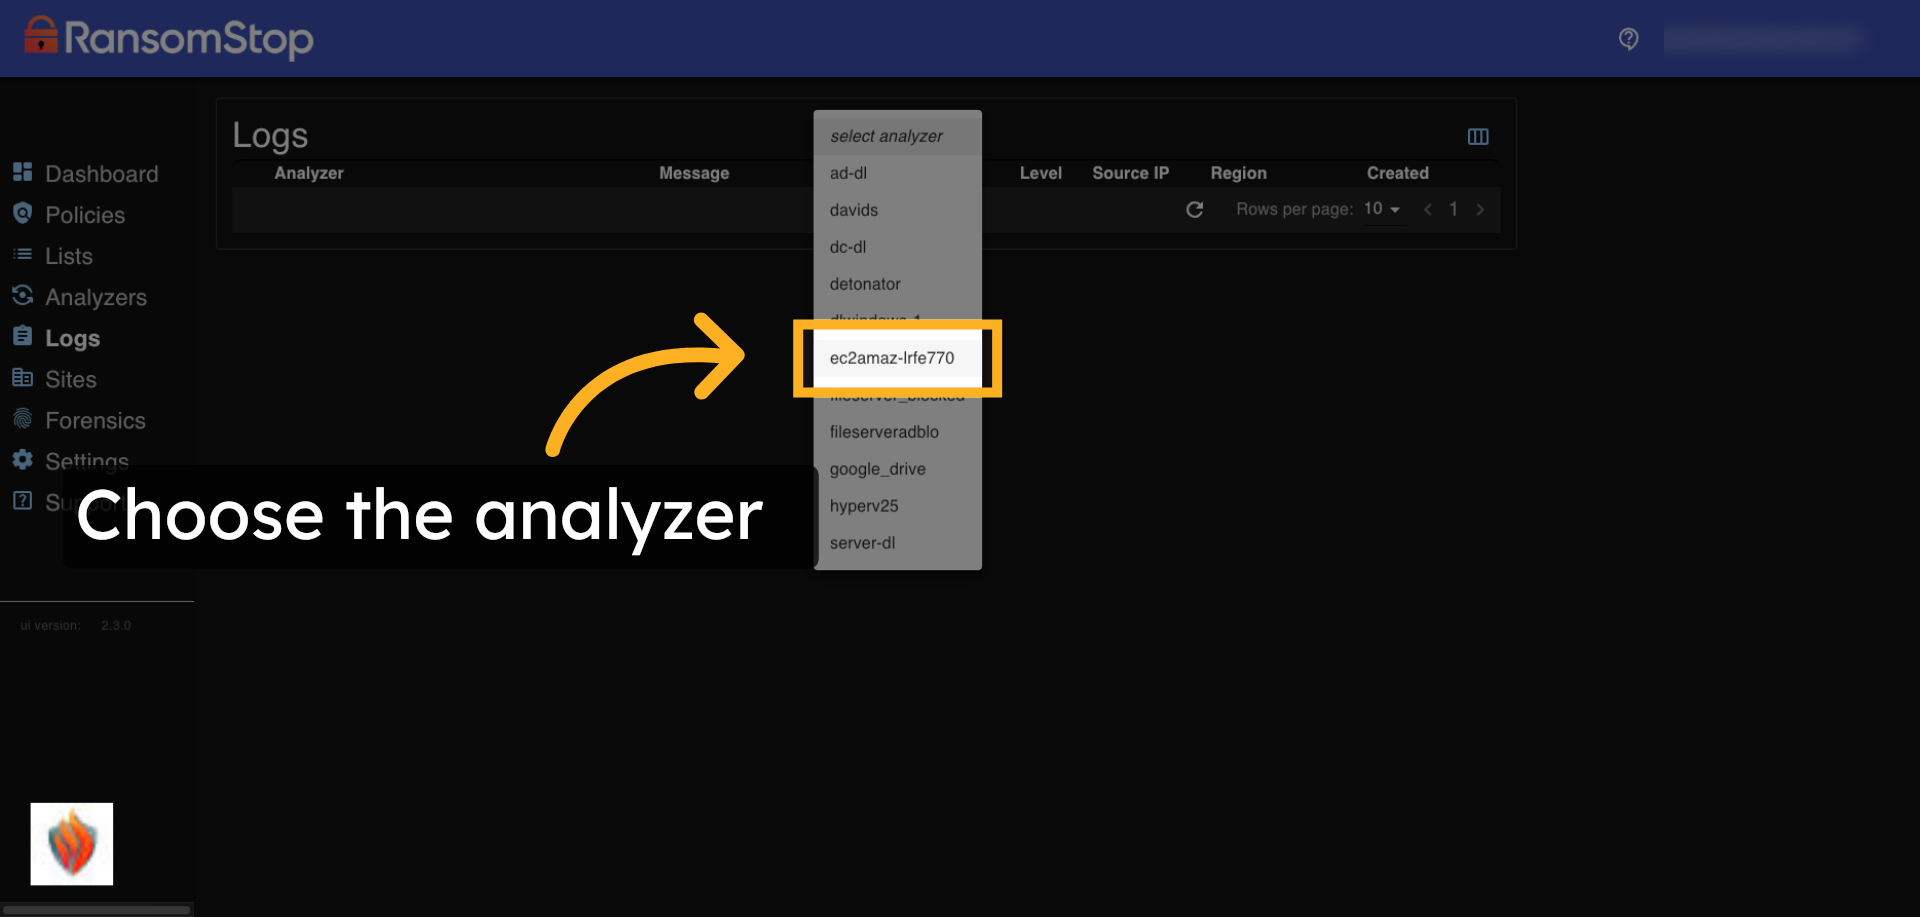
Each analyzer maintains its own log history, allowing you to isolate issues or monitor behavior on a per-device basis.
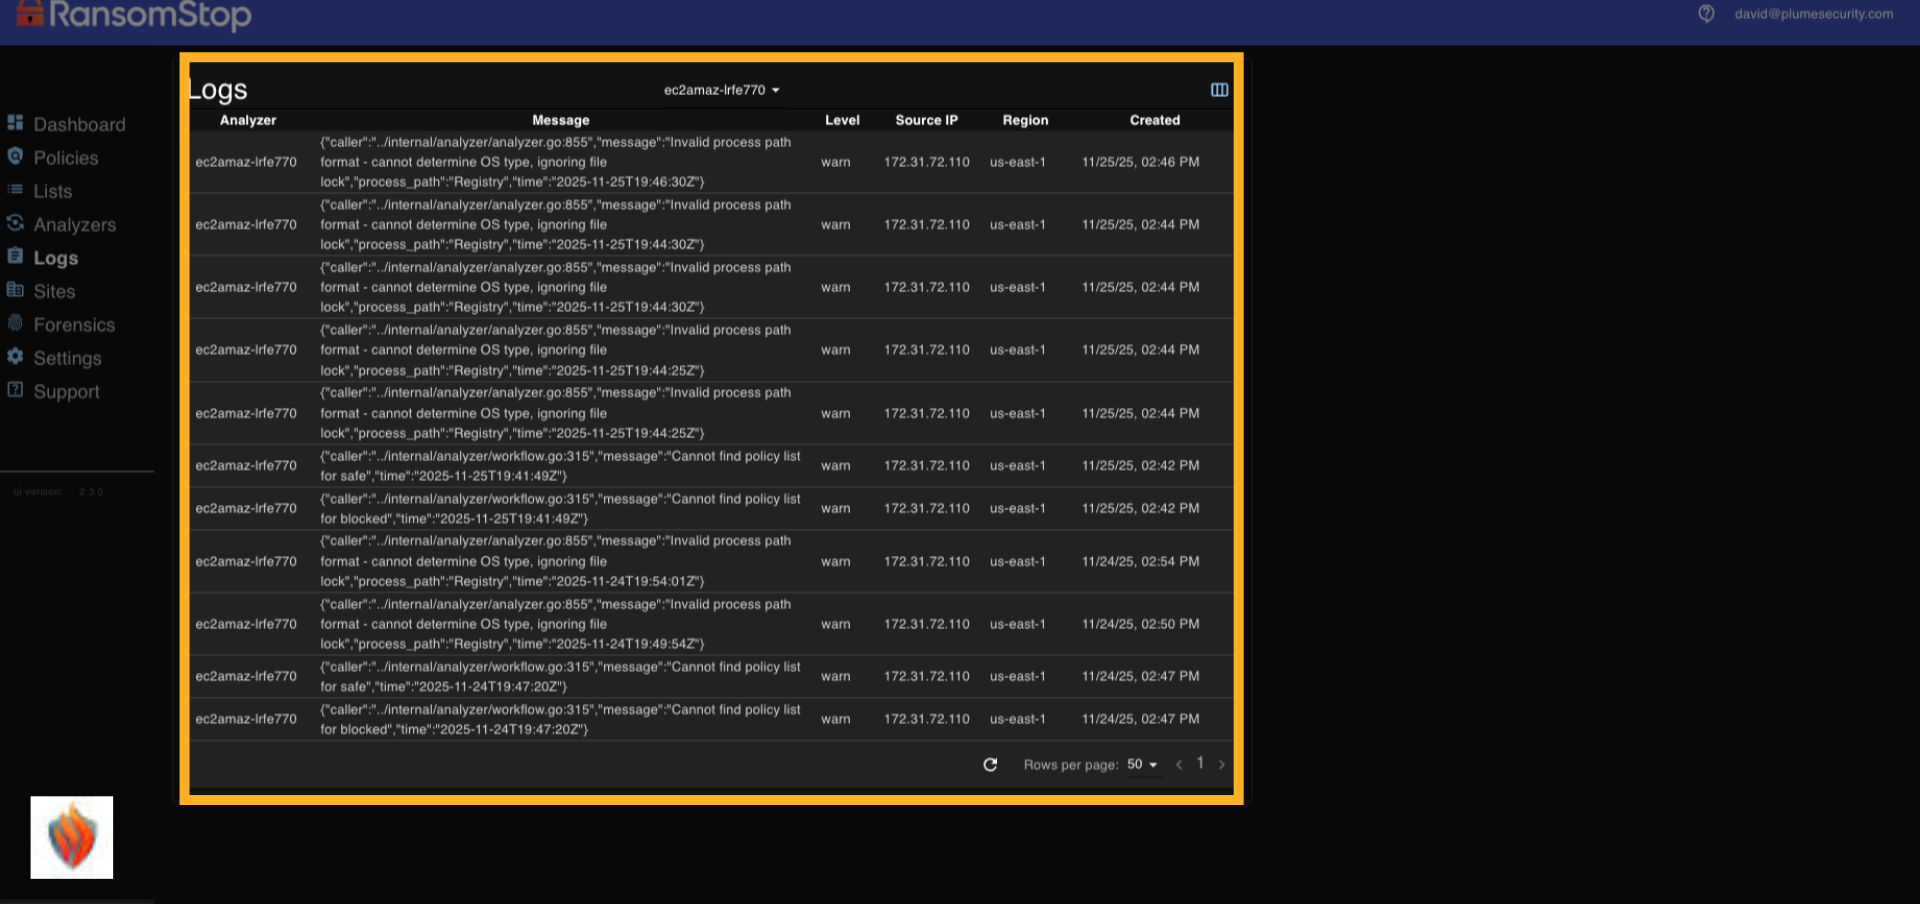
18. Log Entries
Here you can see the logs generated by the selected analyzer. Each entry includes a timestamp, log level, source IP, and region. Messages often contain technical details such as invalid process paths or missing policy references, which help diagnose configuration issues or unexpected behavior. Most entries are marked as Warn or Error depending on severity. These logs are especially useful for forensic analysis and troubleshooting.
Sites
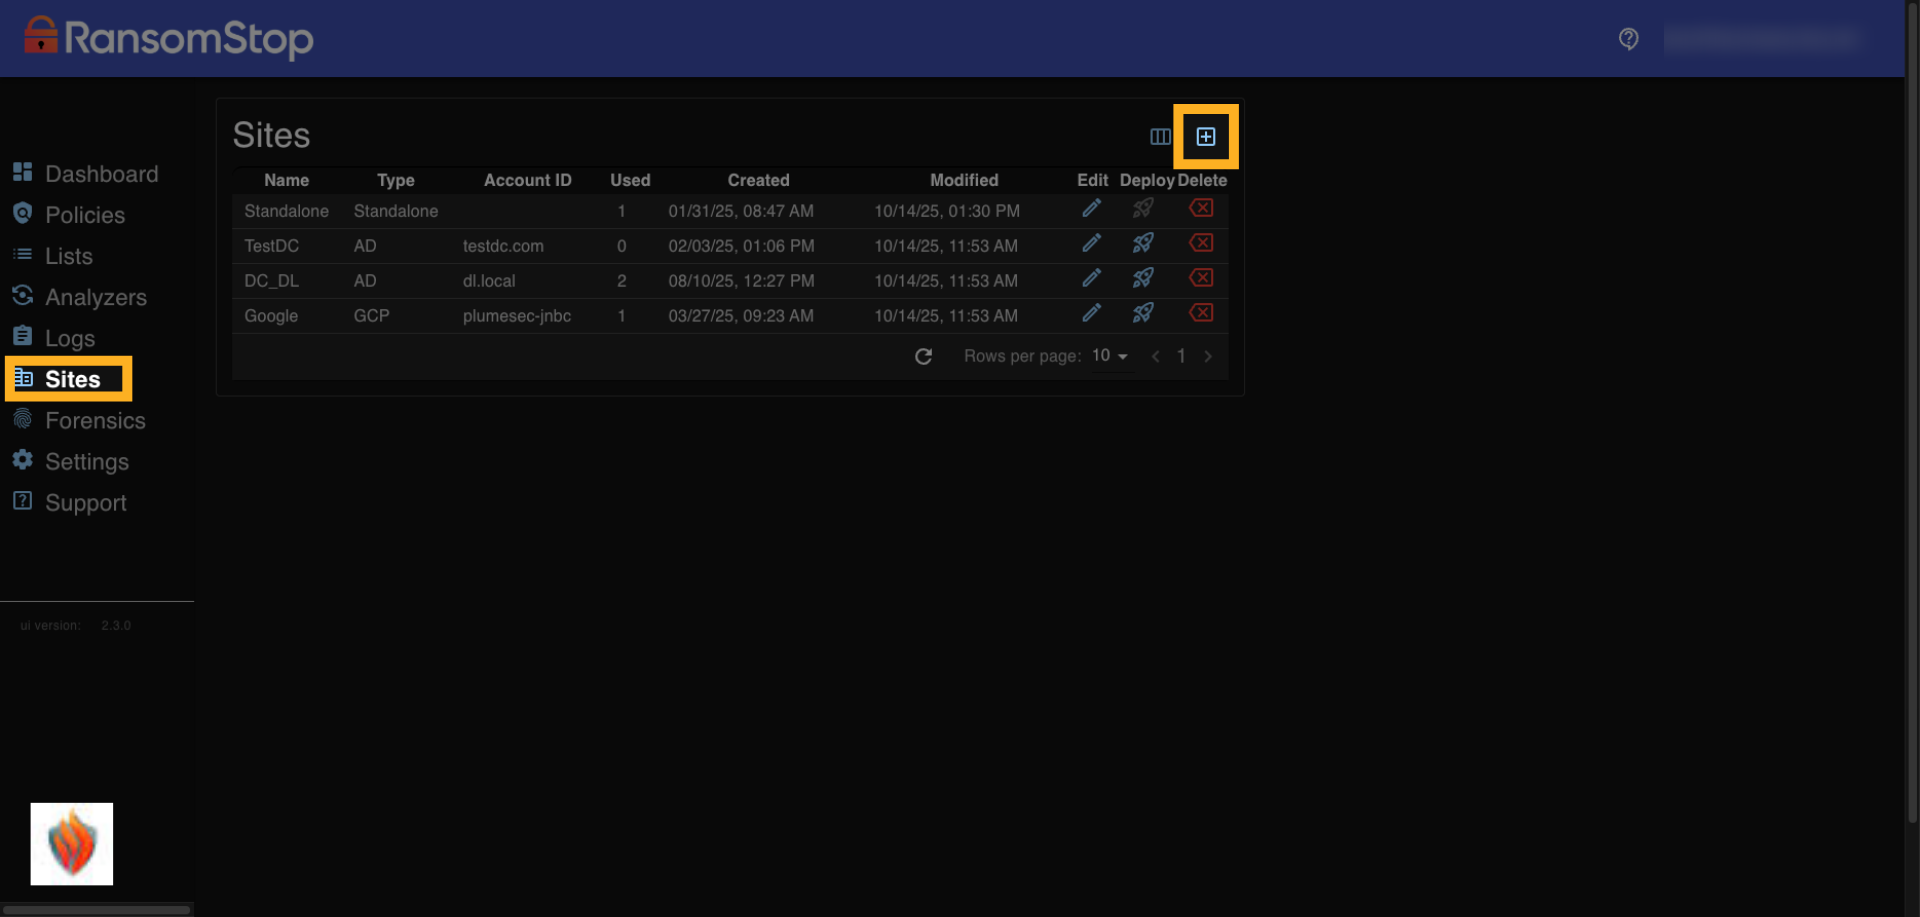
19. Sites Overview
The Sites section lets you organize and manage environments where analyzers are deployed. In many cases, sites are automatically detected during setup. However, you can manually configure site details here. If you already know your naming conventions or deployment structure, you can create sites in advance and assign analyzers to them later. To begin, click the deploy icon to add a device to a site.
20. Site Configuration
This screen shows a site that's been configured for Google Cloud. You can define the site name, type, and project ID to match your infrastructure. This is especially useful for cloud-based environments or distributed deployments. Once a site is configured, analyzers can be assigned to it during installation or updated later to reflect changes in your architecture.

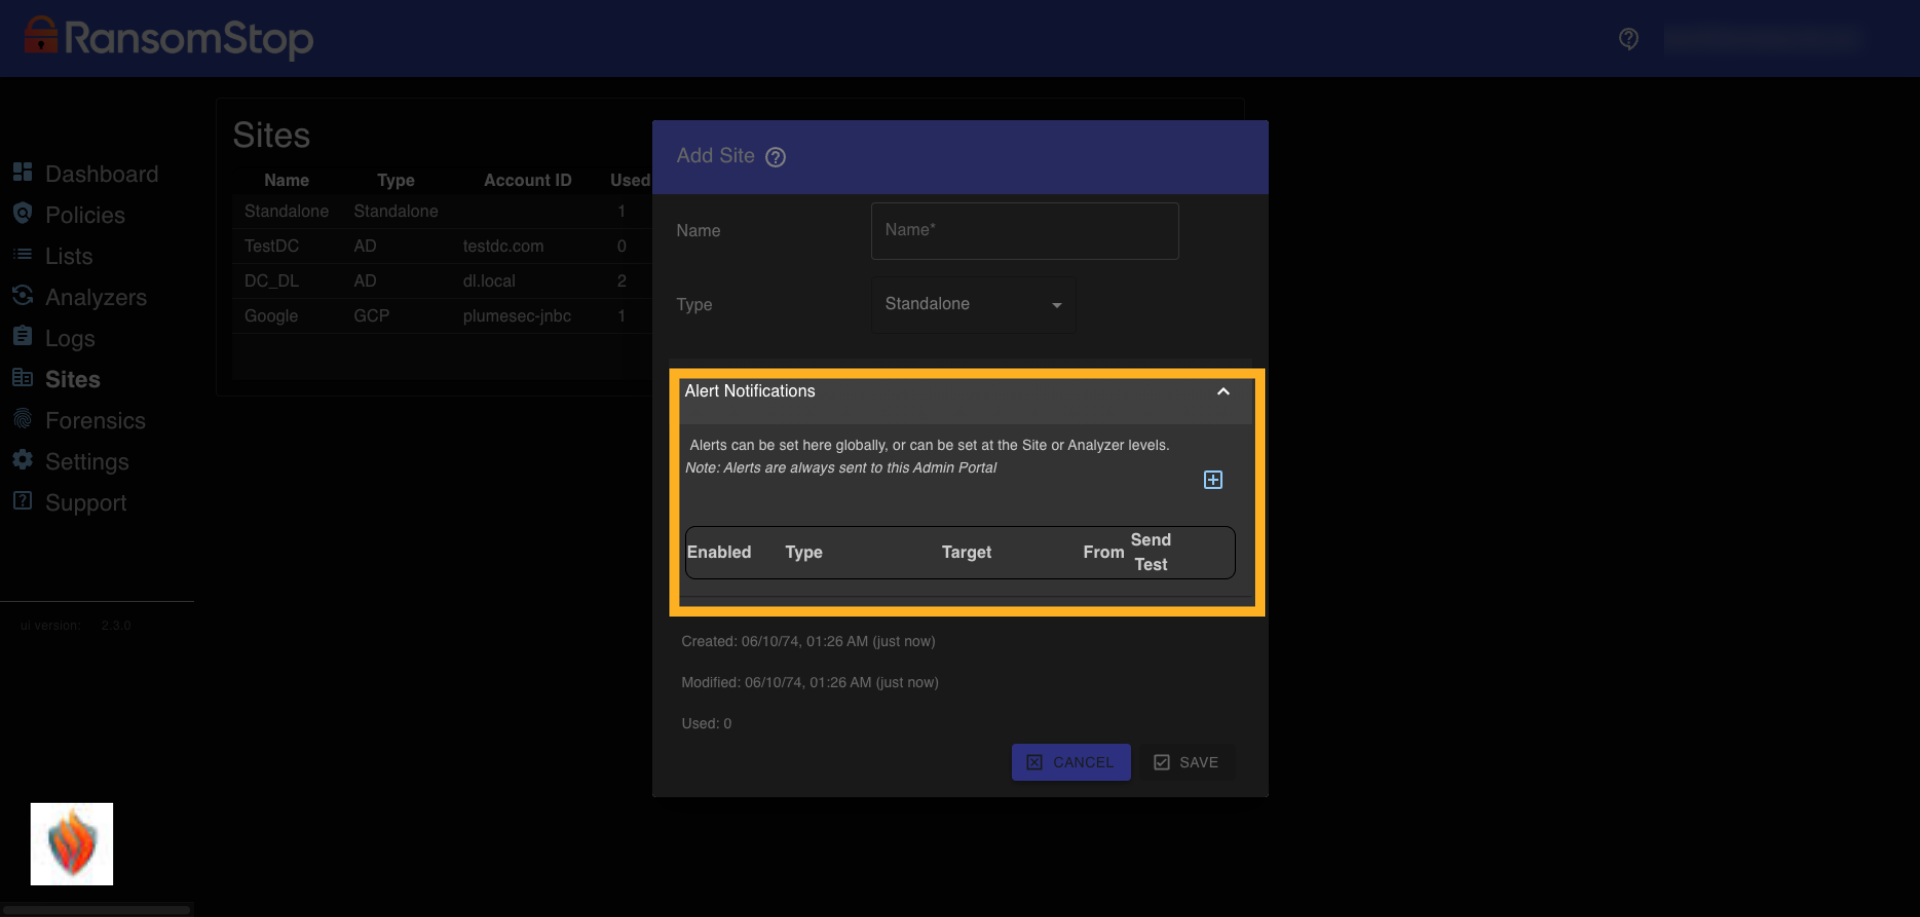
21. Site Notifications
If you're setting up alert notifications globally, you can configure them here at the site level. Alerts can be sent to designated email addresses when analyzer activity occurs within this site. This gives you centralized visibility while allowing for site-specific customization. You can enable alerts, choose the delivery method, and send test messages to verify setup.
Forensics
22. Forensics Overview
In the event of a ransomware attempt, RansomStop is designed to detect and stop the attack in process, preventing encryption and blocking malicious behavior before damage occurs. But if you need to investigate what happened, this is where you'll find the forensic data. The Forensics tab gives you immediate access to detailed evidence captured during the event, helping you understand the scope and origin without delay.

23. Forensics Table
Once inside the Forensics section, you'll have the ability to filter and view a table of collected events. Each entry includes the date and time, destination IP address, and command line activity. This gives you immediate visibility into what happened, when, and where—helping you reconstruct the attack timeline without delay.
24. Event Details
Clicking into a forensic entry reveals deeper context, including process IDs, host names, file paths, and execution details. This level of granularity is essential for understanding how ransomware behaved on the system—and it's all captured automatically by the analyzer.
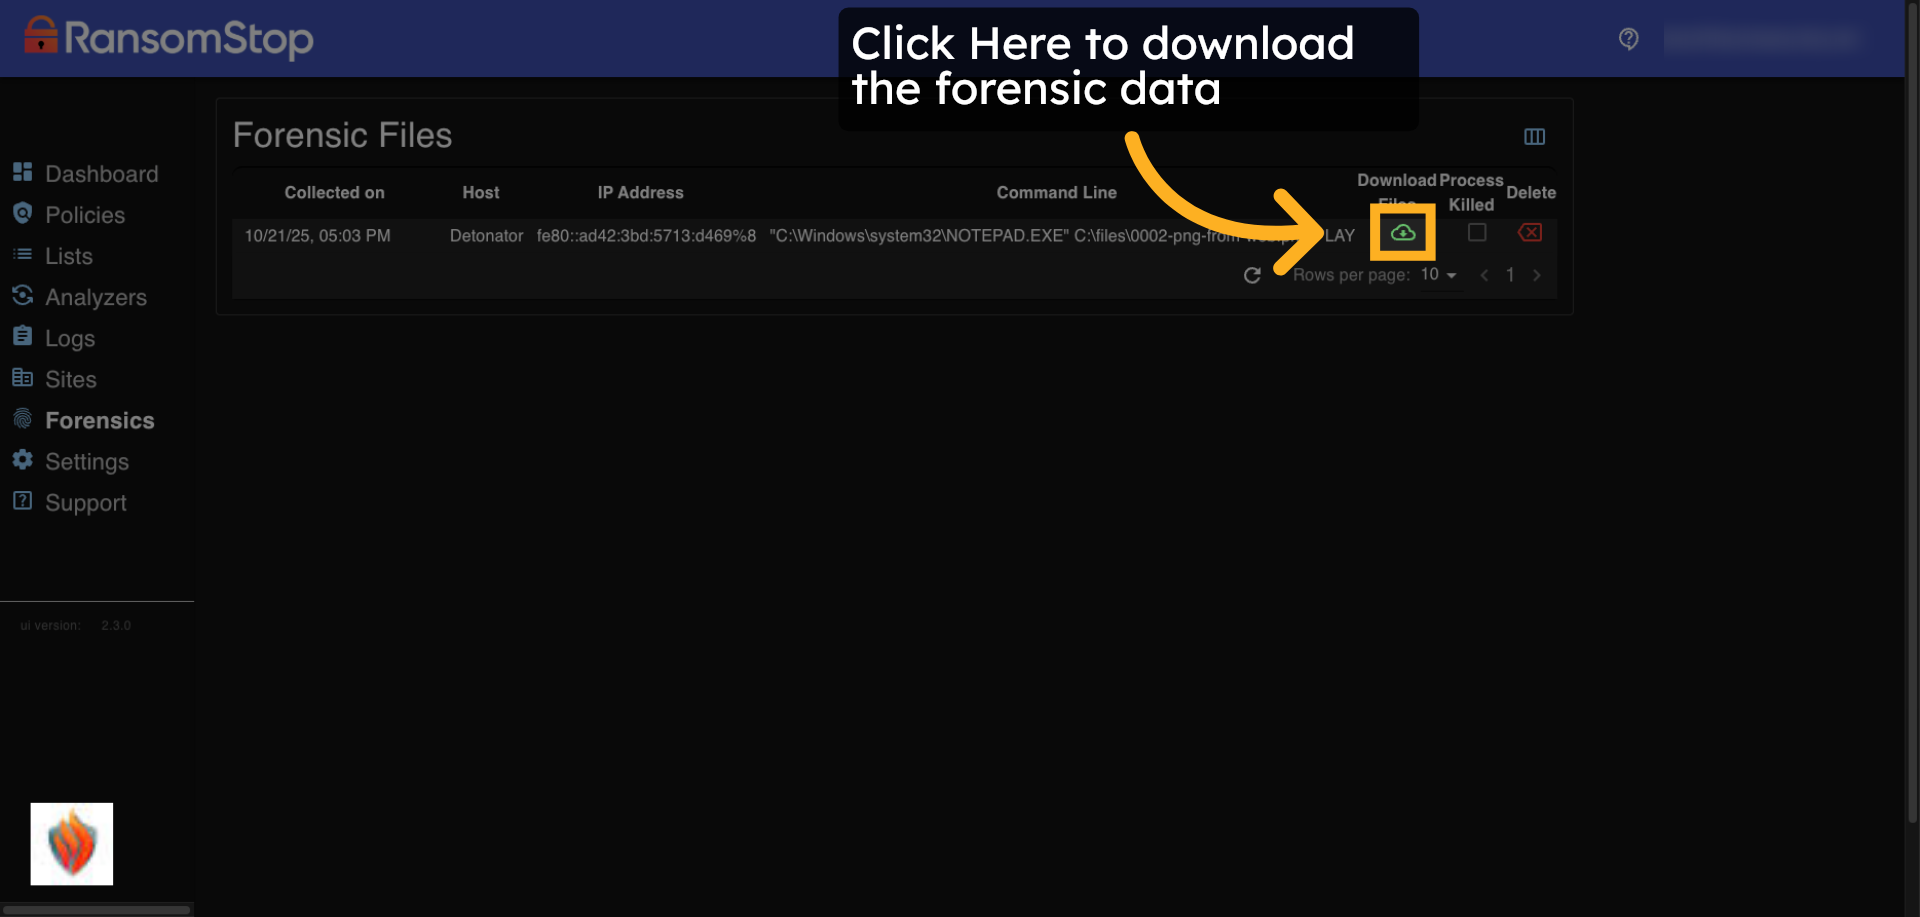
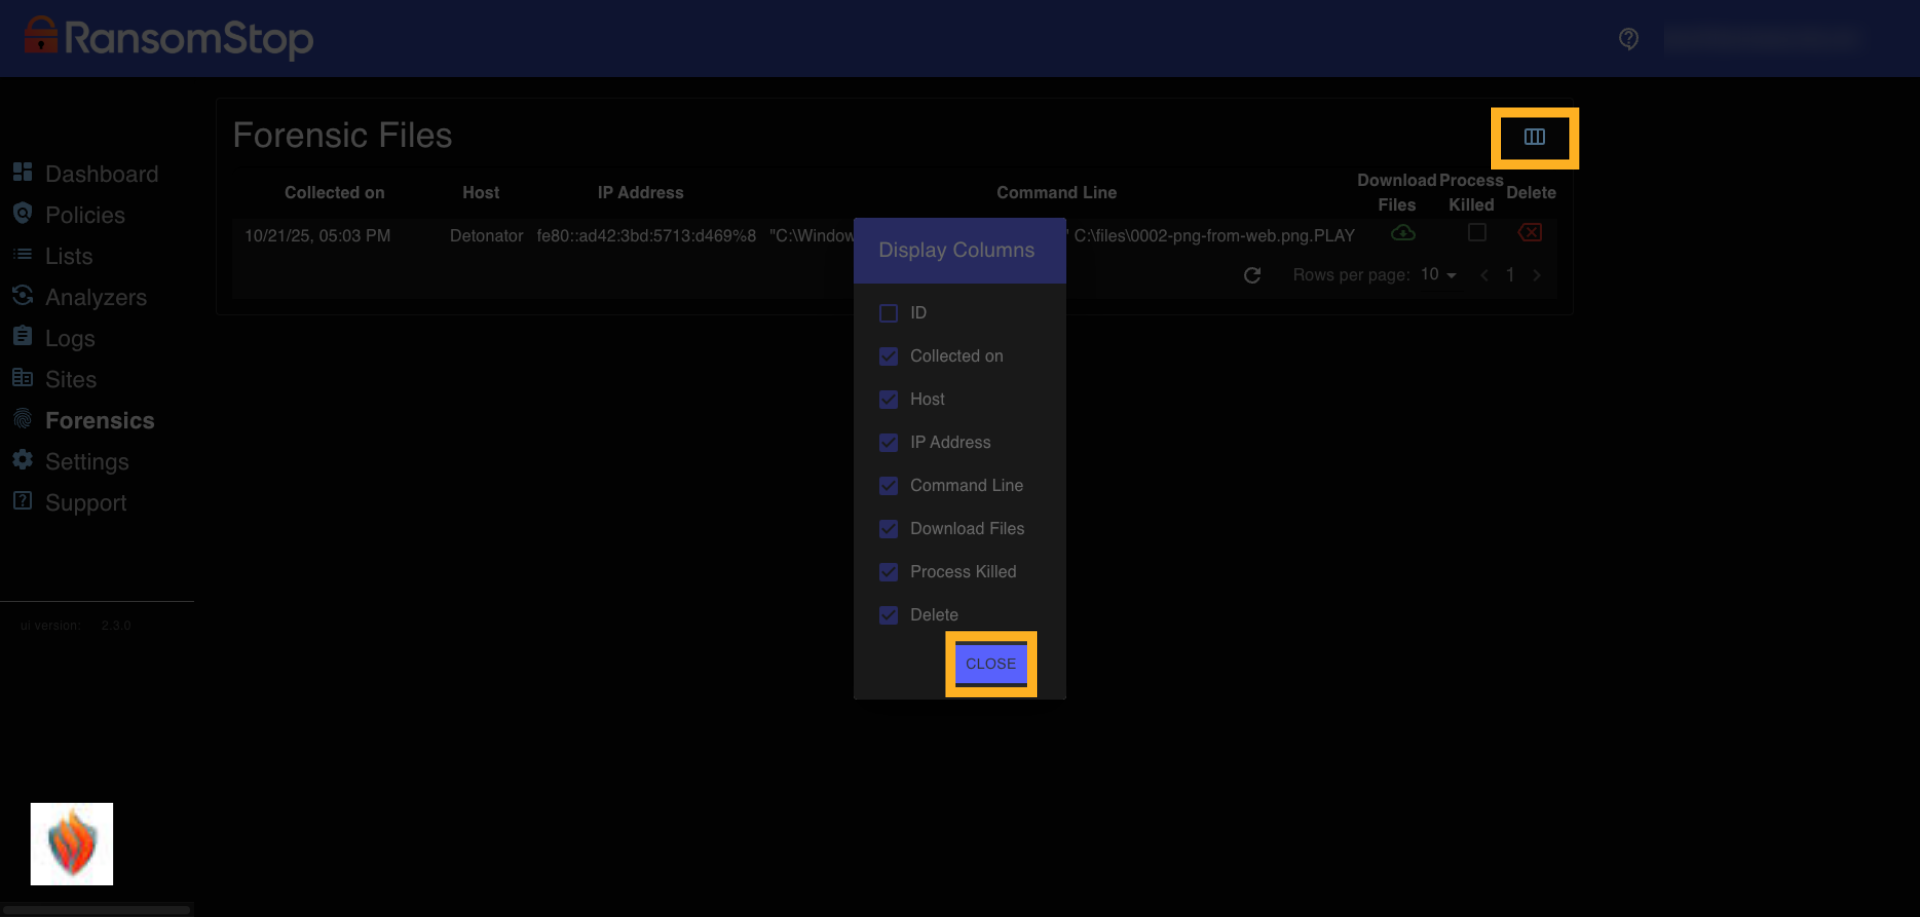
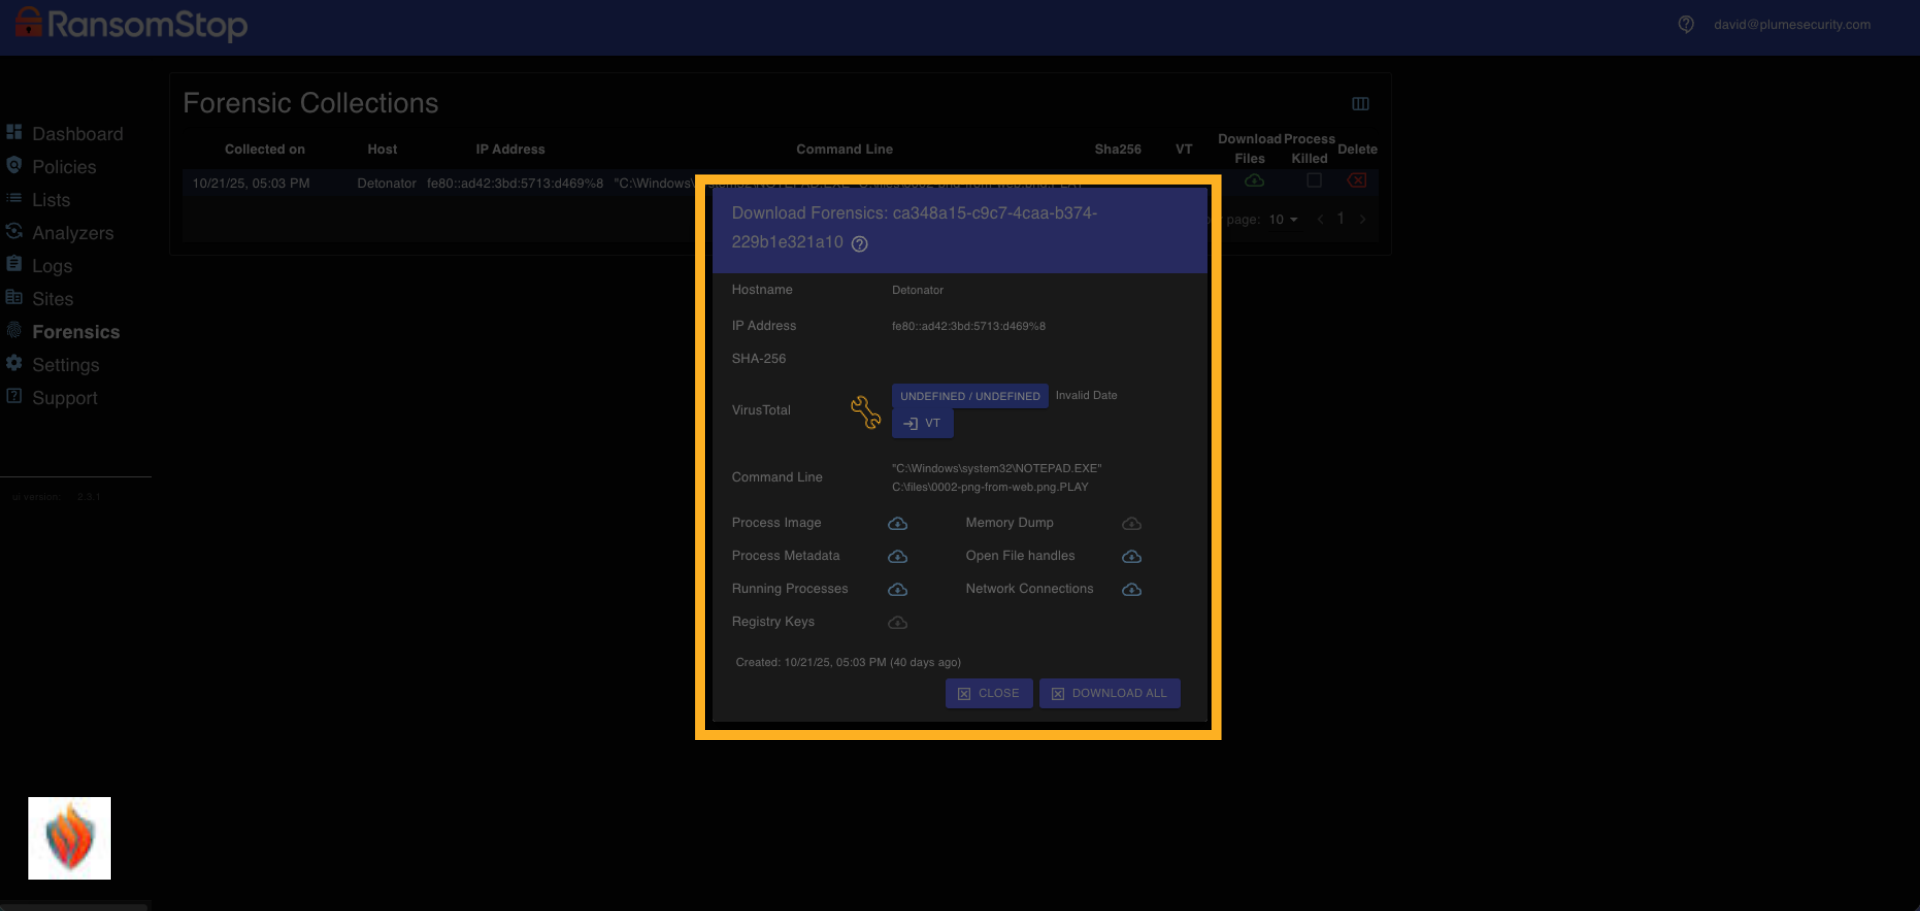
25. Forensic Files
For deeper analysis or compliance reporting, you can download a complete forensic package. This includes memory dumps, open file handles, registry keys, network connections, and more—all captured automatically during the event. This saves hours of manual investigation and adds tremendous value to your incident response. Now with integrated VirusTotal support, RansomStop also provides a conviction rate when known threats are detected. If data is available, you'll see a direct link to VirusTotal for deeper insight into the file's reputation and threat classification.
Settings
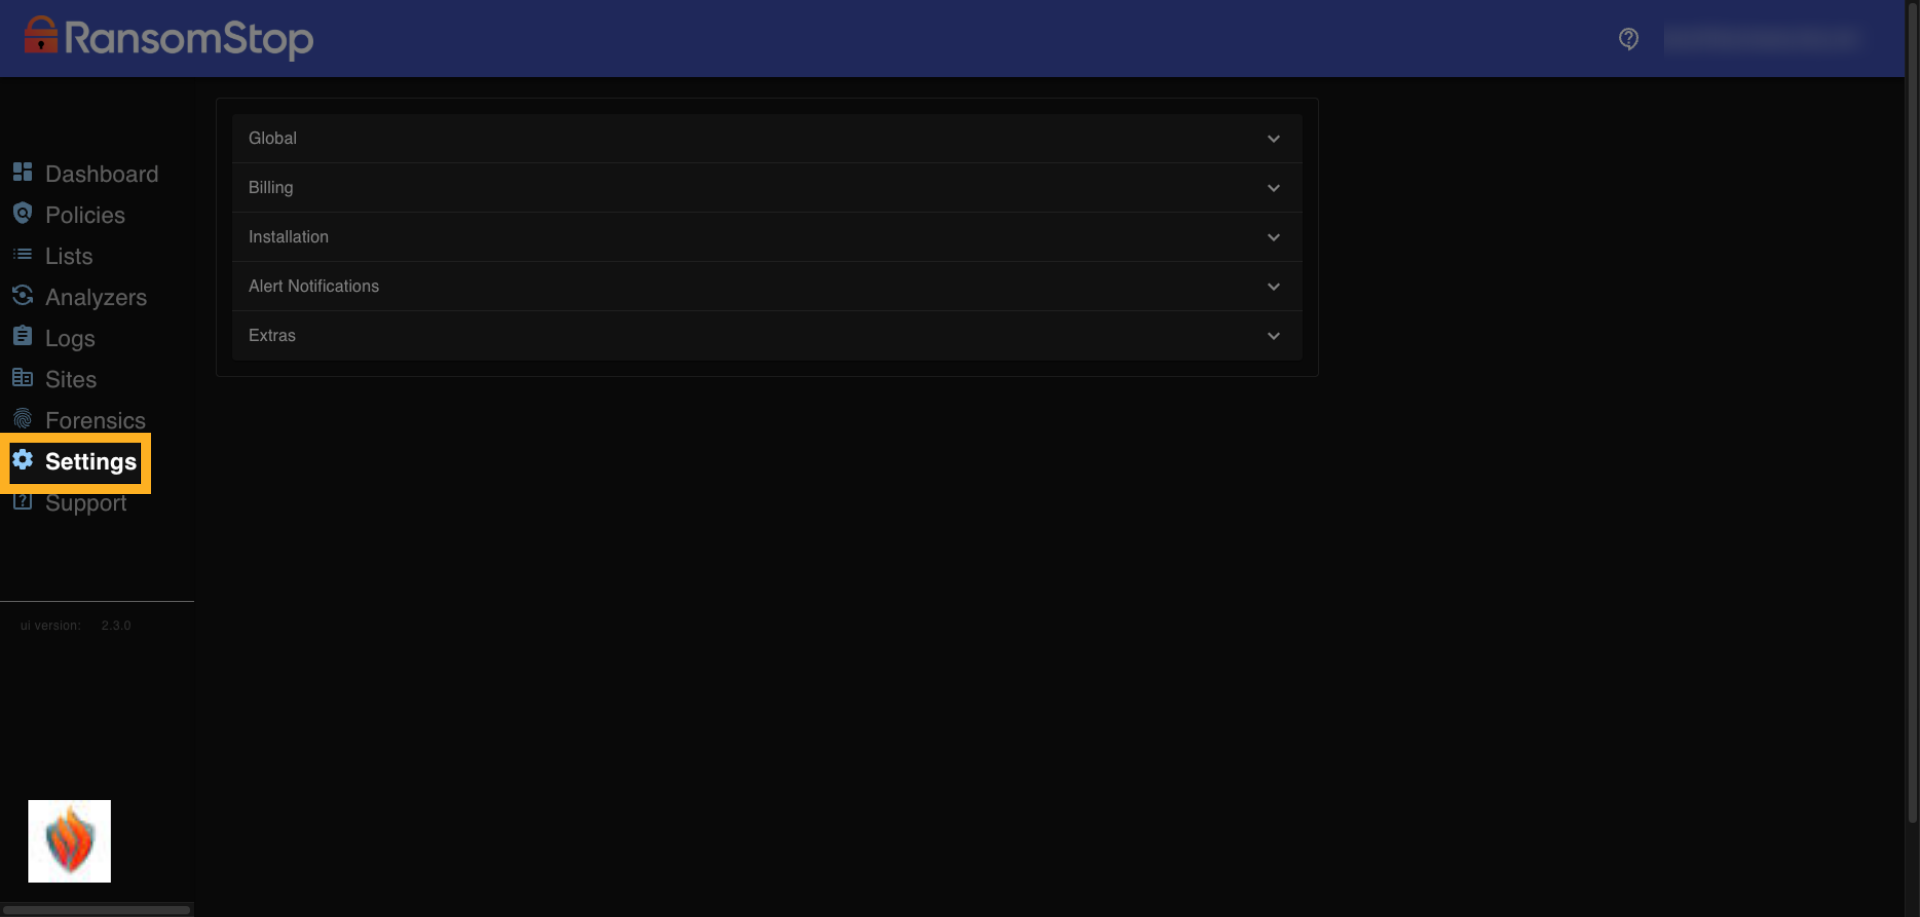
26. Settings Tab
The Settings tab is where you manage global configurations for your RansomStop environment. From here, you can access billing details, installation options, alert notification actions, and additional tools. This central hub helps streamline setup and administration across your deployment, including access to our ransomware simulator which can be used to test detection and response workflows.
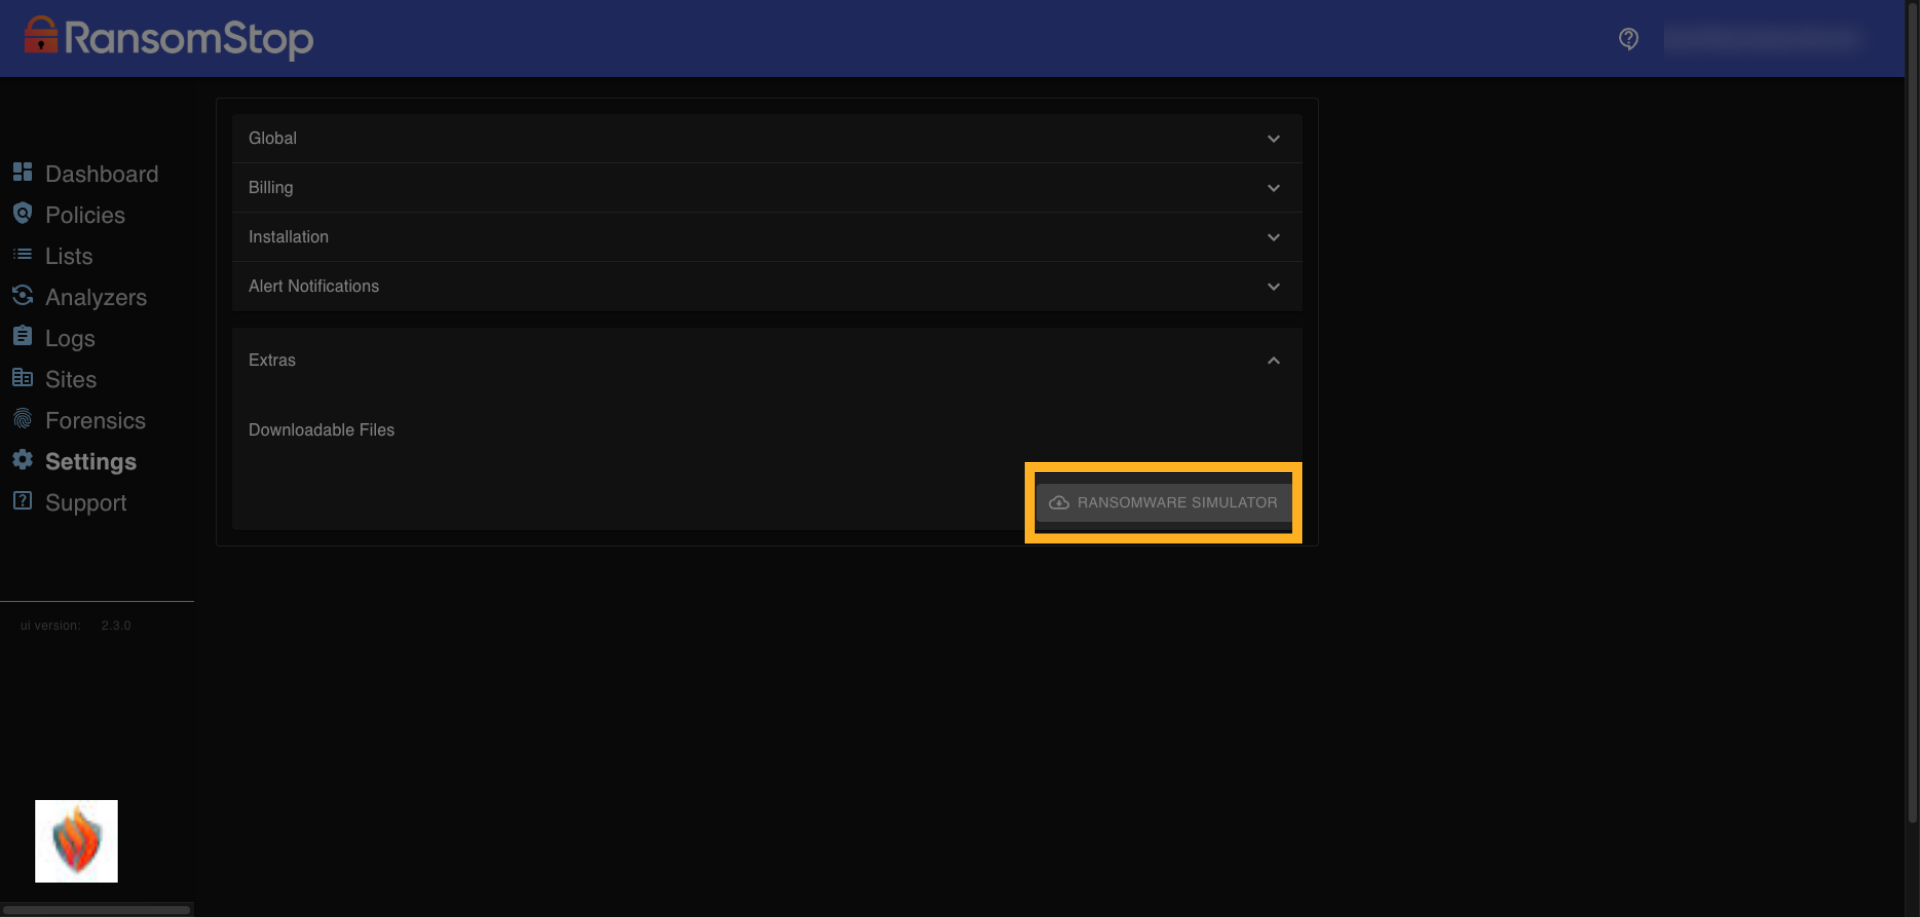
27. Downloadable Files
Under the Downloadable Files section, you'll find tools like the RansomStop Ransomware Simulator. These extras are designed to help you validate your setup and simulate real-world attack scenarios. We'll continue adding more utilities here over time, giving you even more ways to strengthen your defenses and test your response capabilities.
Support
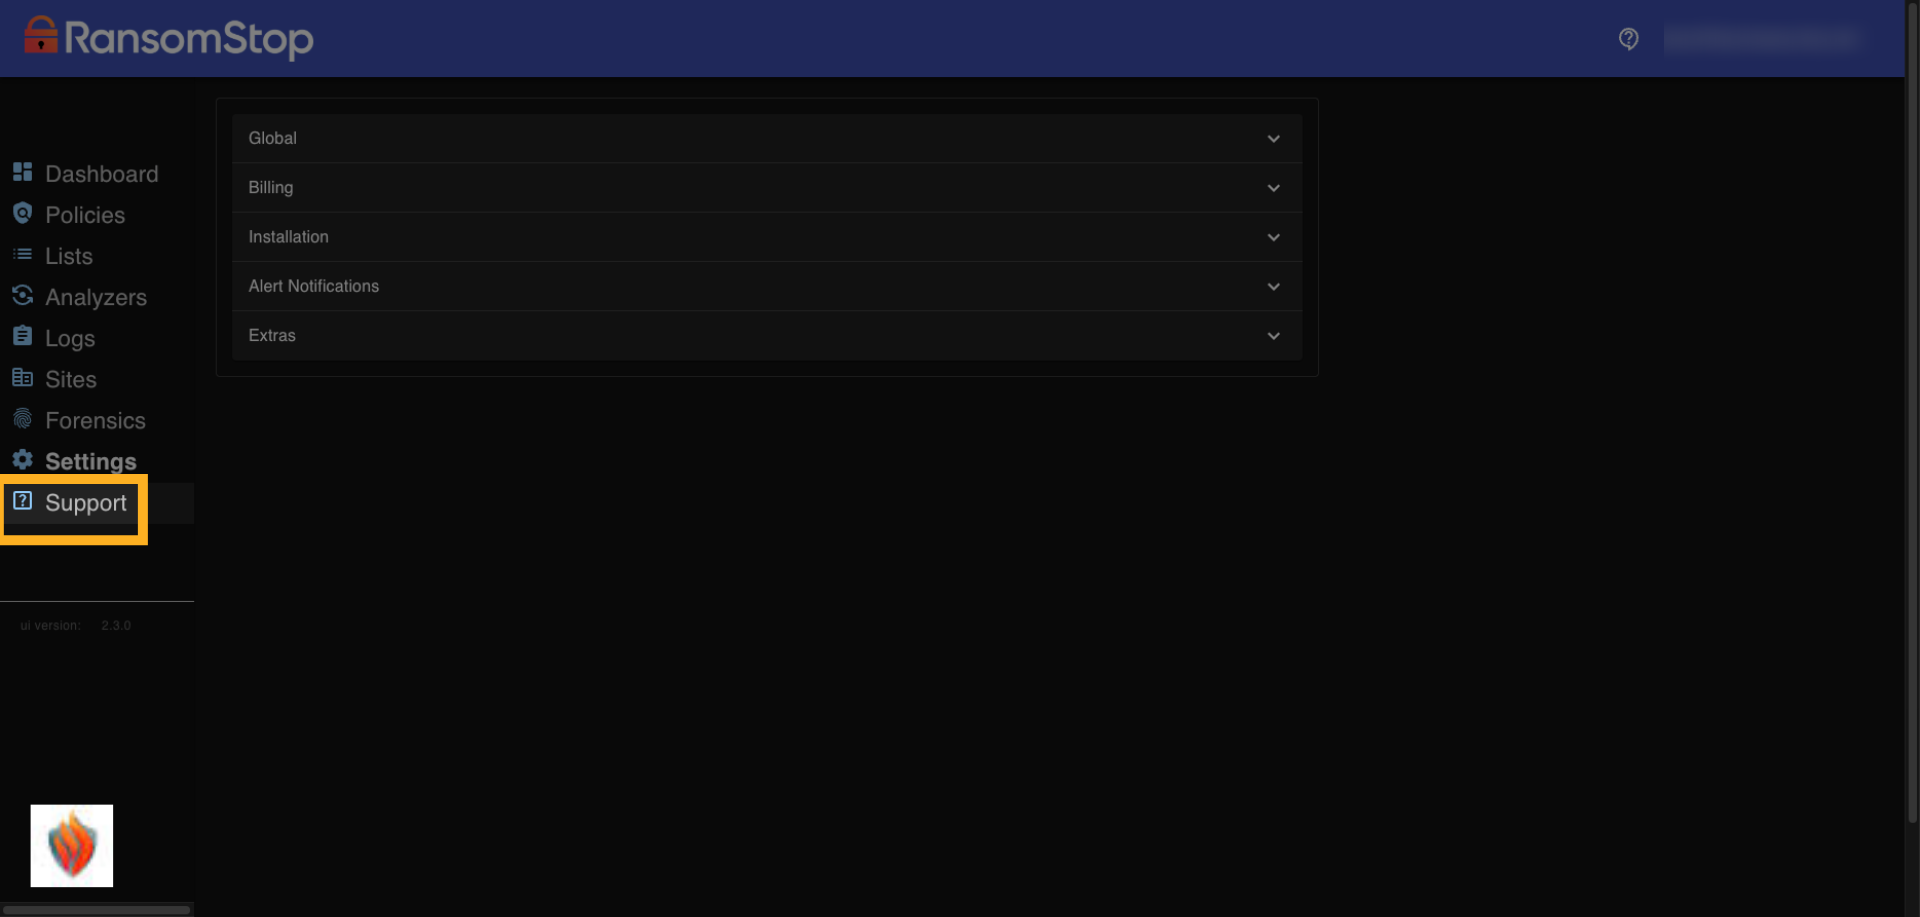
28. Support Tab
The last step in the walkthrough is accessing support. If you need help with configuration, deployment, or troubleshooting, click the Support tab in the sidebar. This connects you to resources that can assist with any part of your RansomStop setup.
This concludes the Getting Started with the RansomStop Dashboard walkthrough.
Related Articles
Installing RansomStop for Windows
Overview Before installation, you will receive a custom URL, a username, and a password. This guide walks you through logging in to the RansomStop dashboard and installing the Windows analyzer. Login to the Dashboard 1. Navigate to Your Custom URL ...Installing RansomStop for Google Drive
Overview RansomStop can monitor Google Drive and automatically suspend compromised user account which exhibit ransomware activity, i.e. malicious encryption events. To do this RansomStop has to be installed in your Google Cloud Platform (GCP) ...RansomStop Installation for NetApp
NetApp + RansomStop Deployment Runbook Part 1 - Pre-Call Validation Complete these checks before the installation call. If all checks pass, the deployment will proceed smoothly. 1. Confirm NetApp Details Have the following ready: Item Example NetApp ...Feature Spotlight: Forensic Collection
Overview After a ransomware attack, incident responders will want to be able to investigate how the attackers were successful. Some of this evidence can be collected afterwards during the investigation, but much of the data is temporary and needs to ...Integrating Active Directory
Overview For RansomStop to be able to suspend users in Active Directory, there is an integration that needs to be configured to allow RansomStop permissions to make those changes in real-time. In a nutshell, an AD service account is created with the ...